Waterloo memorial, Brussels from the road
We’re thrilled to be releasing the imagery of our small yet fascinating country, known by connoisseurs to be Europe's best hidden secret. As we continue to expand Street View, we look forward to bringing many more European countries for you to explore.
Friday, 30 December 2011
Street View to Belgium
Belgium may be a small country but it’s big on culture with more than 300 castles, 40 UNESCO World Heritage sites, 200 museums, 500 types of beer and 2000 chocolate shops. Today we are opening up our beautiful sites to users all over the world as we launch the country at the centre of Europe on Street View.
In the heart of the capital, Brussels, you can now take a virtual stroll around the famous Grand Place which houses the town hall, markets, cafes, museums and the magnificent flower carpet.
Belgium was one of the founding members of the European Union and Brussels is home to many EU and international headquarters. You can now explore the area around the European Parliament and the European Commission.
Beyond Brussels is a world of landscapes, castles and stone-built villages. From the scenic town centre of Bruges to the castles of Bouillon, Belgium’s magnificent sites are now available for all via the Street View feature of Google Maps. Imagery of the historic battlefield of Waterloo is also now available, where the fate of Europe was defined almost 200 years ago.
Thursday, 29 December 2011
The Kindle Fire
Today’s blog post comes to us from Greg Bayer of Pulse, a popular news reading application for iPhone, iPad and Android devices. Pulse has used Google App Engine as a core part of their infrastructure for over a year and they recently celebrated a significant launch. We hope you find their experiences and tips on scaling useful.
 As part of the much anticipated Kindle Fire launch, Pulse was announced as one of the only preloaded apps. When you first un-box the Fire, Pulse will be there waiting for you on the home row, next to Facebook and IMDB!
Scale
The Kindle Fire is projected to sell over five million units this quarter alone. This means that those of us who work on backend infrastructure at Pulse have had to prepare for nearly doubling our user-base in a very short period. We also need to be ready for spikes in load due to press events and the holiday season.
Architecture
As I’ve discussed previously on the Pulse Engineering Blog, Pulse’s infrastructure has been designed with scalability in mind from the beginning. We’ve built our web site and client APIs on top of Google App Engine, which has allowed us to grow steadily from 10s to many 1000s of requests per second, without needing to re-architect our systems.
While restrictive in some ways, we’ve found App Engine’s frontend serving instances (running Python in our case) to be extremely scalable, with minimal operational support from our team. We’ve also found the datastore, memcache, and task queue facilities to be equally scalable.
Pulse’s backend infrastructure provides many critical services to our native applications and web site. For example, we cache and serve optimized feed and image data for each source in our catalog. This allows us to minimize latency and data transfer and is especially important to providing an exceptional user experience on limited mobile connections. Providing this service for millions of users requires us to serve 100Ms of requests per day. As with any well designed App Engine app, the vast majority of these requests are served out of memcache and never hit the datastore. Another useful technique we use is to set public cache control headers wherever possible, to allow Google’s edge cache (shown as cached requests on the graph below) and ISP / mobile carrier caches to serve unchanged content directly to users.
As part of the much anticipated Kindle Fire launch, Pulse was announced as one of the only preloaded apps. When you first un-box the Fire, Pulse will be there waiting for you on the home row, next to Facebook and IMDB!
Scale
The Kindle Fire is projected to sell over five million units this quarter alone. This means that those of us who work on backend infrastructure at Pulse have had to prepare for nearly doubling our user-base in a very short period. We also need to be ready for spikes in load due to press events and the holiday season.
Architecture
As I’ve discussed previously on the Pulse Engineering Blog, Pulse’s infrastructure has been designed with scalability in mind from the beginning. We’ve built our web site and client APIs on top of Google App Engine, which has allowed us to grow steadily from 10s to many 1000s of requests per second, without needing to re-architect our systems.
While restrictive in some ways, we’ve found App Engine’s frontend serving instances (running Python in our case) to be extremely scalable, with minimal operational support from our team. We’ve also found the datastore, memcache, and task queue facilities to be equally scalable.
Pulse’s backend infrastructure provides many critical services to our native applications and web site. For example, we cache and serve optimized feed and image data for each source in our catalog. This allows us to minimize latency and data transfer and is especially important to providing an exceptional user experience on limited mobile connections. Providing this service for millions of users requires us to serve 100Ms of requests per day. As with any well designed App Engine app, the vast majority of these requests are served out of memcache and never hit the datastore. Another useful technique we use is to set public cache control headers wherever possible, to allow Google’s edge cache (shown as cached requests on the graph below) and ISP / mobile carrier caches to serve unchanged content directly to users.
 Costs
Based on App Engine’s projected billing statements leading up to the recent pricing changes, we were concerned that our costs might increase significantly. To prepare for these changes and the expected additional load from Kindle Fire users, we invested some time in diagnosing and reducing these costs. In most cases, the increases turned out to be an indicator of inefficiencies in our code and/or in the App Engine scheduler. With a little optimization, we have reduced these costs dramatically.
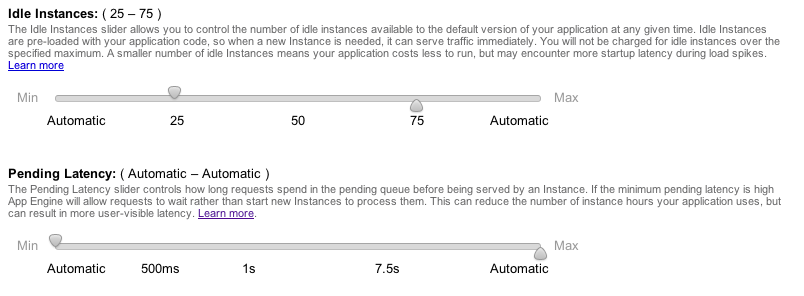
The new tuning sliders for the scheduler make it possible to rein in overly aggressive instance allocation. In the old pricing structure, idle instance time wasn’t charged for at all, so these inefficiencies were usually ignored. Now App Engine charges for all instance time by default. However, any time App Engine runs more idle instances than you’ve allowed, those hours are free. This acts as a hint to the scheduler, helping it reduce unneeded idle instances. By doing some testing to find the optimal cost vs spike latency tolerance and setting the sliders to those levels, we were able to reduce our frontend instance costs to near original levels. Our heavy usage of memcache (which is still free!) also helps keep our instance hours down.
Costs
Based on App Engine’s projected billing statements leading up to the recent pricing changes, we were concerned that our costs might increase significantly. To prepare for these changes and the expected additional load from Kindle Fire users, we invested some time in diagnosing and reducing these costs. In most cases, the increases turned out to be an indicator of inefficiencies in our code and/or in the App Engine scheduler. With a little optimization, we have reduced these costs dramatically.
The new tuning sliders for the scheduler make it possible to rein in overly aggressive instance allocation. In the old pricing structure, idle instance time wasn’t charged for at all, so these inefficiencies were usually ignored. Now App Engine charges for all instance time by default. However, any time App Engine runs more idle instances than you’ve allowed, those hours are free. This acts as a hint to the scheduler, helping it reduce unneeded idle instances. By doing some testing to find the optimal cost vs spike latency tolerance and setting the sliders to those levels, we were able to reduce our frontend instance costs to near original levels. Our heavy usage of memcache (which is still free!) also helps keep our instance hours down.
 Since datastore operations used to be charged under the umbrella of CPU hours, it was difficult to know the cost of these operations under the old pricing structure. This meant it was easy to miss application inefficiencies, especially for write-heavy workloads where additional indexes can have a multiplicative effect on costs. In our case, the new datastore write operations metric led us to notice some inefficiencies in our design and a tendency to overuse indexes. We are now working to minimize the number of indexes our queries rely on, and this has started to reduce our write costs.
Preparing for the Kindle Fire Launch
We took a few additional steps to prepare for the expected load increase and spikes associated with the Fire’s launch. First, we contacted App Engine’s support team to warn them of the expected increase. This is recommended for any app at or near 10,000 requests per second (to make sure your application is correctly provisioned). We also signed up for a Premier account which gets us additional support and simpler billing.
Architecturally, we decided to split our load across three primary applications, each serving different use cases. While this makes it harder to access data across these applications, those same boundaries serve to isolate potential load-related problems and make tuning simpler. In our case, we were able to divide certain parts of our infrastructure, where cross application data access was less important and load would be significant. Until App Engine provides more visibility into and control of memcache eviction policies, this approach also helps prevent lower priority data from evicting critical data.
I’m hopeful that in the near future such division of services will not be required. Individually tunable load isolation zones and memcache controls would certainly make it a lot more appealing to have everything in a single application. Until then, this technique works quite well, and helps to simplify how we think about scaling.
Since datastore operations used to be charged under the umbrella of CPU hours, it was difficult to know the cost of these operations under the old pricing structure. This meant it was easy to miss application inefficiencies, especially for write-heavy workloads where additional indexes can have a multiplicative effect on costs. In our case, the new datastore write operations metric led us to notice some inefficiencies in our design and a tendency to overuse indexes. We are now working to minimize the number of indexes our queries rely on, and this has started to reduce our write costs.
Preparing for the Kindle Fire Launch
We took a few additional steps to prepare for the expected load increase and spikes associated with the Fire’s launch. First, we contacted App Engine’s support team to warn them of the expected increase. This is recommended for any app at or near 10,000 requests per second (to make sure your application is correctly provisioned). We also signed up for a Premier account which gets us additional support and simpler billing.
Architecturally, we decided to split our load across three primary applications, each serving different use cases. While this makes it harder to access data across these applications, those same boundaries serve to isolate potential load-related problems and make tuning simpler. In our case, we were able to divide certain parts of our infrastructure, where cross application data access was less important and load would be significant. Until App Engine provides more visibility into and control of memcache eviction policies, this approach also helps prevent lower priority data from evicting critical data.
I’m hopeful that in the near future such division of services will not be required. Individually tunable load isolation zones and memcache controls would certainly make it a lot more appealing to have everything in a single application. Until then, this technique works quite well, and helps to simplify how we think about scaling.
As part of the much anticipated Kindle Fire launch, Pulse was announced as one of the only preloaded apps. When you first un-box the Fire, Pulse will be there waiting for you on the home row, next to Facebook and IMDB!
Scale
The Kindle Fire is projected to sell over five million units this quarter alone. This means that those of us who work on backend infrastructure at Pulse have had to prepare for nearly doubling our user-base in a very short period. We also need to be ready for spikes in load due to press events and the holiday season.
Architecture
As I’ve discussed previously on the Pulse Engineering Blog, Pulse’s infrastructure has been designed with scalability in mind from the beginning. We’ve built our web site and client APIs on top of Google App Engine, which has allowed us to grow steadily from 10s to many 1000s of requests per second, without needing to re-architect our systems.
While restrictive in some ways, we’ve found App Engine’s frontend serving instances (running Python in our case) to be extremely scalable, with minimal operational support from our team. We’ve also found the datastore, memcache, and task queue facilities to be equally scalable.
Pulse’s backend infrastructure provides many critical services to our native applications and web site. For example, we cache and serve optimized feed and image data for each source in our catalog. This allows us to minimize latency and data transfer and is especially important to providing an exceptional user experience on limited mobile connections. Providing this service for millions of users requires us to serve 100Ms of requests per day. As with any well designed App Engine app, the vast majority of these requests are served out of memcache and never hit the datastore. Another useful technique we use is to set public cache control headers wherever possible, to allow Google’s edge cache (shown as cached requests on the graph below) and ISP / mobile carrier caches to serve unchanged content directly to users.
Costs
Based on App Engine’s projected billing statements leading up to the recent pricing changes, we were concerned that our costs might increase significantly. To prepare for these changes and the expected additional load from Kindle Fire users, we invested some time in diagnosing and reducing these costs. In most cases, the increases turned out to be an indicator of inefficiencies in our code and/or in the App Engine scheduler. With a little optimization, we have reduced these costs dramatically.
The new tuning sliders for the scheduler make it possible to rein in overly aggressive instance allocation. In the old pricing structure, idle instance time wasn’t charged for at all, so these inefficiencies were usually ignored. Now App Engine charges for all instance time by default. However, any time App Engine runs more idle instances than you’ve allowed, those hours are free. This acts as a hint to the scheduler, helping it reduce unneeded idle instances. By doing some testing to find the optimal cost vs spike latency tolerance and setting the sliders to those levels, we were able to reduce our frontend instance costs to near original levels. Our heavy usage of memcache (which is still free!) also helps keep our instance hours down.
Since datastore operations used to be charged under the umbrella of CPU hours, it was difficult to know the cost of these operations under the old pricing structure. This meant it was easy to miss application inefficiencies, especially for write-heavy workloads where additional indexes can have a multiplicative effect on costs. In our case, the new datastore write operations metric led us to notice some inefficiencies in our design and a tendency to overuse indexes. We are now working to minimize the number of indexes our queries rely on, and this has started to reduce our write costs.
Preparing for the Kindle Fire Launch
We took a few additional steps to prepare for the expected load increase and spikes associated with the Fire’s launch. First, we contacted App Engine’s support team to warn them of the expected increase. This is recommended for any app at or near 10,000 requests per second (to make sure your application is correctly provisioned). We also signed up for a Premier account which gets us additional support and simpler billing.
Architecturally, we decided to split our load across three primary applications, each serving different use cases. While this makes it harder to access data across these applications, those same boundaries serve to isolate potential load-related problems and make tuning simpler. In our case, we were able to divide certain parts of our infrastructure, where cross application data access was less important and load would be significant. Until App Engine provides more visibility into and control of memcache eviction policies, this approach also helps prevent lower priority data from evicting critical data.
I’m hopeful that in the near future such division of services will not be required. Individually tunable load isolation zones and memcache controls would certainly make it a lot more appealing to have everything in a single application. Until then, this technique works quite well, and helps to simplify how we think about scaling.Google Maps 6.0 for Android
Google Maps for mobile had its sixth birthday earlier this month and we’re celebrating by releasing the next generation of Google Maps for Android, which is first to get indoor Google Maps—announced moments ago on the Official Google Blog. We also have two other great additions in this release: a new way to switch between features in the toolbar and a new Places home screen.
Mapping the vast indoors
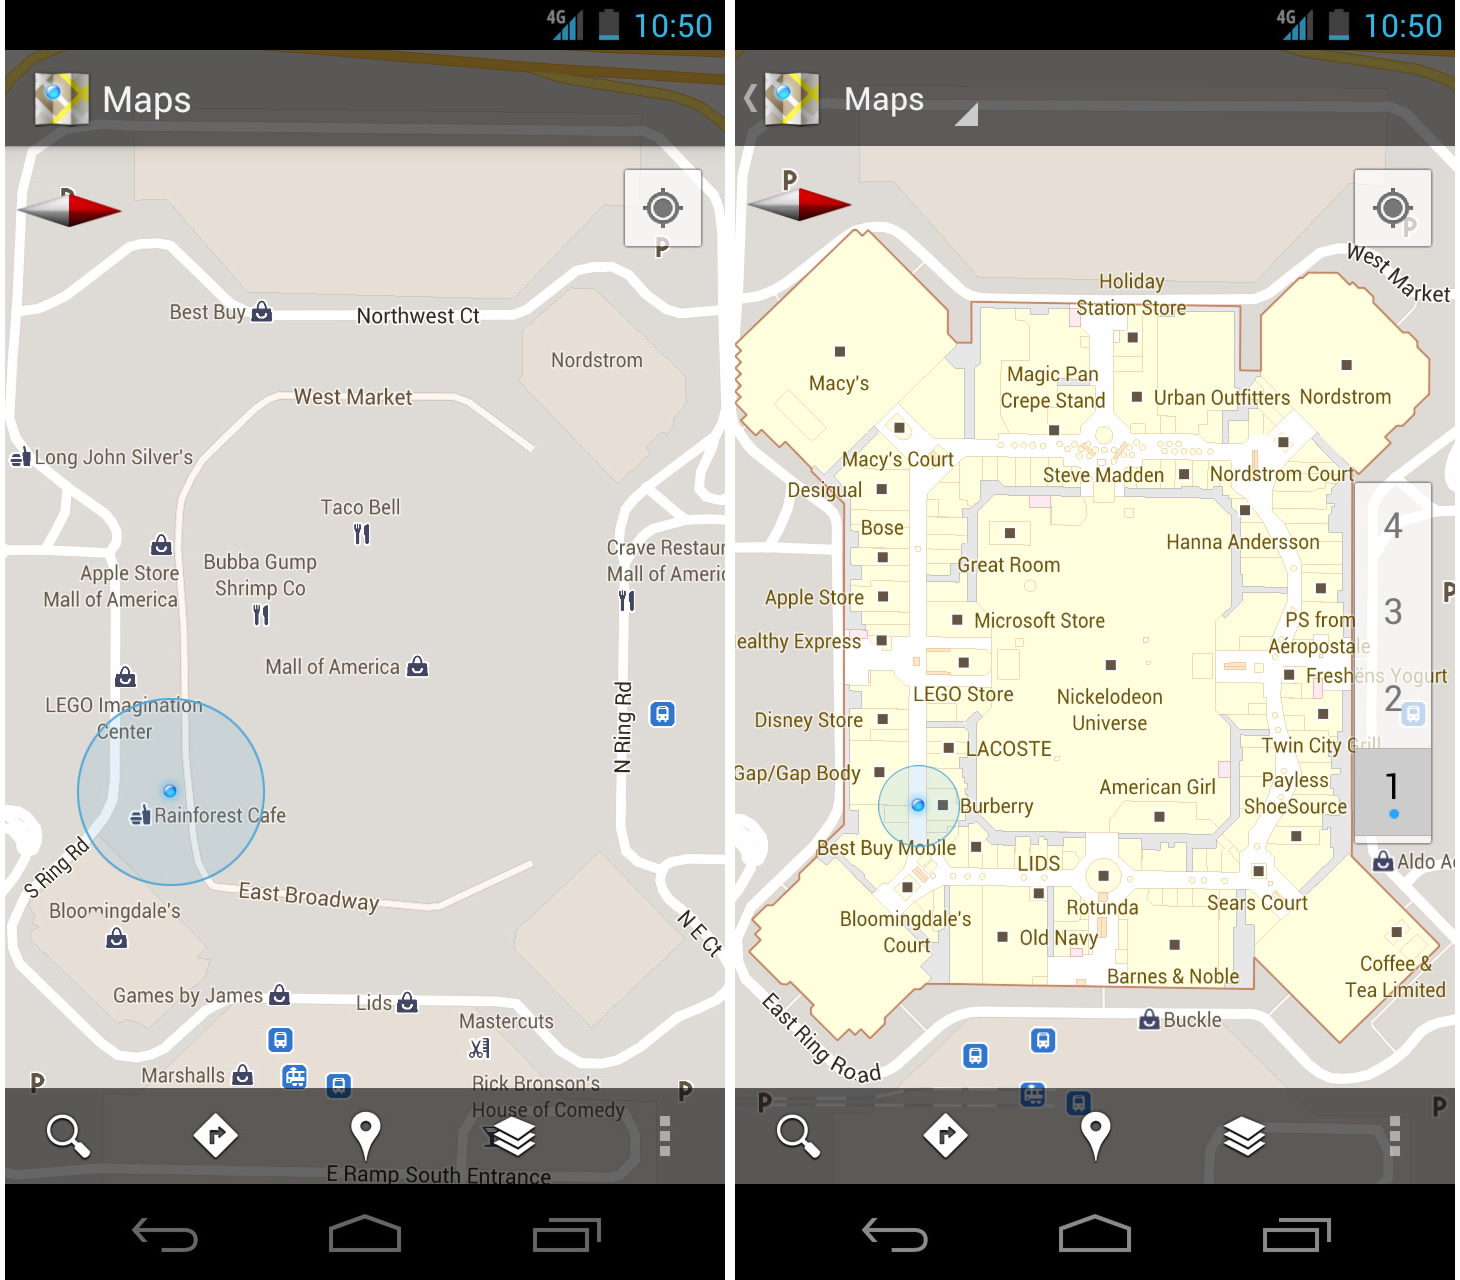
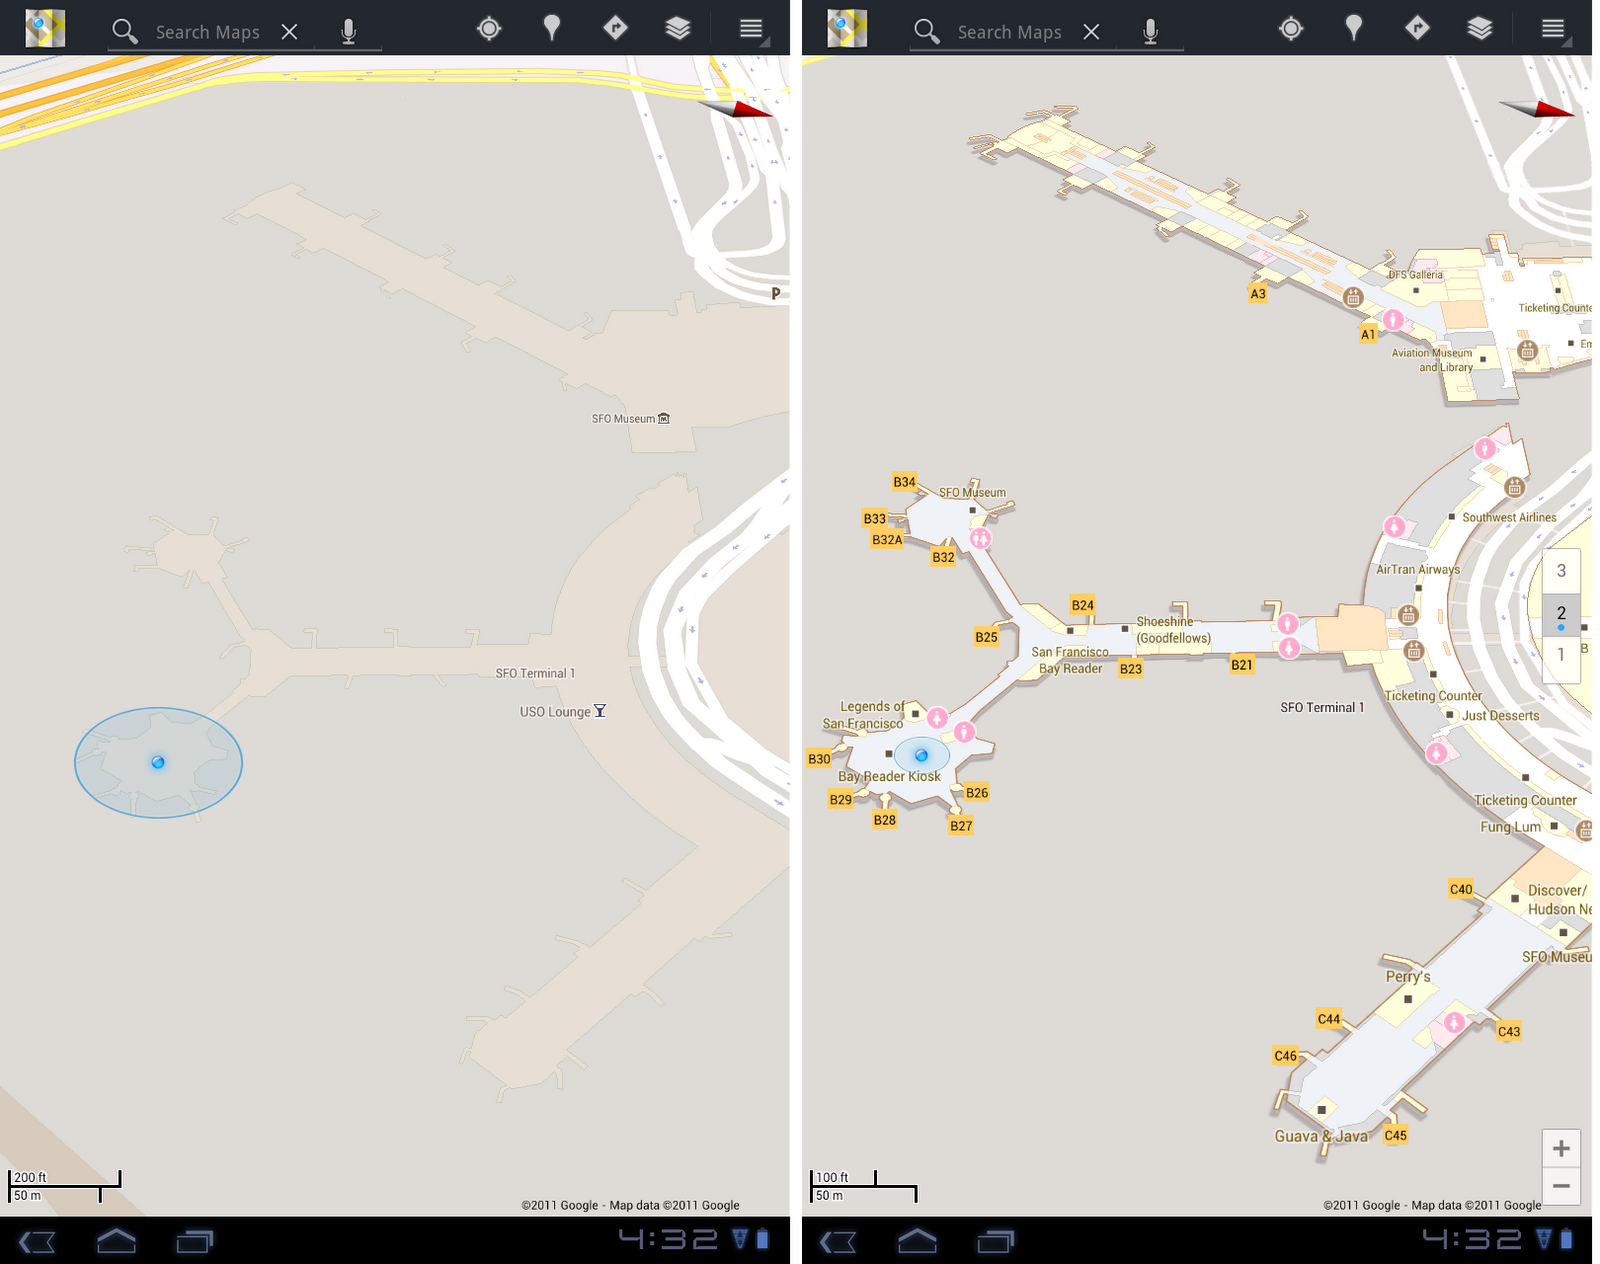
When you’re inside an airport, shopping mall, retail store, or other public space, Google Maps 6.0 for Android brings the freestanding map directory to the palm of your hands -- helping you determine where you are, what floor you're on, and where to go indoors. For example, in this busy travel season, you can use Google Maps 6.0 to help you find your way around airports.
Detailed floor plans automatically appear when you’re viewing the map and zoomed-in on a building where indoor map data is available. The familiar “blue dot” icon indicates your location within several meters, and when you move up or down a level in a building with multiple floors, the map will automatically update to display which floor you’re on.
See the full announcement for more details or to demo indoor Google Maps, start here.
 Mall of America in Minneapolis before and after, with a floor selector
 San Francisco International Airport before and after, with 3D tilt
Switching between features gets easier
When you open Google Maps for Android, you can do many things: view your location on the map, discover where to go with Places, get GPS turn-by-turn directions with Navigation, check in to share your location, and more. We wanted to make it easier to hop from one feature to another; so, we’ve added a drop-down menu to the top toolbar for quick access.
San Francisco International Airport before and after, with 3D tilt
Switching between features gets easier
When you open Google Maps for Android, you can do many things: view your location on the map, discover where to go with Places, get GPS turn-by-turn directions with Navigation, check in to share your location, and more. We wanted to make it easier to hop from one feature to another; so, we’ve added a drop-down menu to the top toolbar for quick access.
 New drop down menu to switch between features
We hope this menu helps you get to your favorite parts of Google Maps faster or shows you some features you haven’t tried yet.
Discovering what’s great nearby with the new Places home screen
The new Places home screen includes popular searches for your current location, so you can find the best spots in any area you travel.
New drop down menu to switch between features
We hope this menu helps you get to your favorite parts of Google Maps faster or shows you some features you haven’t tried yet.
Discovering what’s great nearby with the new Places home screen
The new Places home screen includes popular searches for your current location, so you can find the best spots in any area you travel.
 Redesigned Places home screen with popular searches for your area
To start using Google Maps 6.0 for Android, download the update from Android Market. This update works for Android OS 2.1+ devices everywhere Google Maps is currently available.
Redesigned Places home screen with popular searches for your area
To start using Google Maps 6.0 for Android, download the update from Android Market. This update works for Android OS 2.1+ devices everywhere Google Maps is currently available.
 Mall of America in Minneapolis before and after, with a floor selector
 San Francisco International Airport before and after, with 3D tilt
Switching between features gets easier
When you open Google Maps for Android, you can do many things: view your location on the map, discover where to go with Places, get GPS turn-by-turn directions with Navigation, check in to share your location, and more. We wanted to make it easier to hop from one feature to another; so, we’ve added a drop-down menu to the top toolbar for quick access.
San Francisco International Airport before and after, with 3D tilt
Switching between features gets easier
When you open Google Maps for Android, you can do many things: view your location on the map, discover where to go with Places, get GPS turn-by-turn directions with Navigation, check in to share your location, and more. We wanted to make it easier to hop from one feature to another; so, we’ve added a drop-down menu to the top toolbar for quick access.


Wednesday, 28 December 2011
"Ocean" layer in Google Earth
 As Google continues to add more content to the various Layers in Google Earth, they often take time to reorganize things a little bit. This time it's the "Ocean" layer that's been somewhat shifted around.
In particular:
• Some items have been moved to the Earth Gallery, including the "Marie Tharp Historical Map", "MBA: Seafood Watch", "MCS: Fish to Eat", "Human Impacts", "Arctic Sea Ice", "Sea Surface Temperature" and "Ocean Expeditions".
• The "ARKive: Endangered Ocean Species" layer is now turned on by default, and shown as purple circles on the globe.
• "Ocean Observations" has been moved to the [Weather] folder.
In all, it's a nice group of changes. It seems that Google has tried to simplify the [Ocean] layer quite a bit to make it easier for new users to dig in. I'm not sure how many people use the [Earth Gallery] feature, but perhaps this will encourage more people to check it out.
As Google continues to add more content to the various Layers in Google Earth, they often take time to reorganize things a little bit. This time it's the "Ocean" layer that's been somewhat shifted around.
In particular:
• Some items have been moved to the Earth Gallery, including the "Marie Tharp Historical Map", "MBA: Seafood Watch", "MCS: Fish to Eat", "Human Impacts", "Arctic Sea Ice", "Sea Surface Temperature" and "Ocean Expeditions".
• The "ARKive: Endangered Ocean Species" layer is now turned on by default, and shown as purple circles on the globe.
• "Ocean Observations" has been moved to the [Weather] folder.
In all, it's a nice group of changes. It seems that Google has tried to simplify the [Ocean] layer quite a bit to make it easier for new users to dig in. I'm not sure how many people use the [Earth Gallery] feature, but perhaps this will encourage more people to check it out.
Saturday, 24 December 2011
Track Santa in Google Earth with Norad
NORAD’s tradition of tracking Santa on Christmas Eve started in 1955, when a Sears and Roebuck ad promoting the Talk-to-Santa hotline inadvertently sent callers to CONAD (NORAD’s predecessor) commander-in-chief’s operations hotline. After recovering from the surprise that the call was not from the Pentagon or the White House but instead a little boy inquiring if the commander was Santa Claus, Colonel Harry Shoup asked his team to check their radar for signs of Santa’s sleigh and a tradition was born.
The Santa tracking tradition has grown over the years and today it’s also possible to track Santa using Google Earth and Google Maps on the NORAD Santa site, and on your mobile phone as well. Starting tomorrow (Saturday, December 24) at 2:00 a.m. EST, visit www.noradsanta.org to follow Santa’s journey from the North Pole to homes all over the globe. This year there are many ways to keep tabs on Santa’s sleigh, no matter how quickly it moves:
 Santa flying over London in Google Earth
NORAD Tracks Santa is a special project near and dear to all of us involved. I started working on the program seven years ago and it’s been a thrill to watch it grow over the years. Recently, I was given the opportunity to speak at TEDActive about the origins of NORAD Tracks Santa and how Google has brought this to life in Google Earth.
I’d like to thank all of Santa’s “elves” that helped out across Google and NORAD far and wide. Happy Holidays!
Santa flying over London in Google Earth
NORAD Tracks Santa is a special project near and dear to all of us involved. I started working on the program seven years ago and it’s been a thrill to watch it grow over the years. Recently, I was given the opportunity to speak at TEDActive about the origins of NORAD Tracks Santa and how Google has brought this to life in Google Earth.
I’d like to thank all of Santa’s “elves” that helped out across Google and NORAD far and wide. Happy Holidays!
- Follow Santa on Google Maps: Visit www.noradsanta.org to see where Santa is currently flying and where he’s headed next on Google Maps. Click on the video icons to watch “Santa cam” videos from all over the world, and the gift icons will display information about each city along the route.
- Watch Santa fly in 3D with the Google Earth plug-in: If you have the Google Earth plug-in installed on your computer, you can track Santa’s location in 3D and see him deliver presents everywhere from the mountain villages of the Swiss Alps to the white sand beaches of Hawaii.
- Track Santa from your mobile phone: Follow Santa on the go by searching for [santa] on the Google Maps for mobile app.
- Get updates via social media: The NORAD team will be posting updates about Santa’s flight throughout the day on December 24. Follow them on Google+ , Twitter or Facebook for live updates.
- Subscribe to the NORAD Tracks Santa YouTube channel: All “Santa cam ” videos will be posted on the NORAD Tracks Santa YouTube channel as they’re captured. You can also watch a recap of Santa’s 2010 trip . Check back often for updates!
Santa flying over London in Google Earth
NORAD Tracks Santa is a special project near and dear to all of us involved. I started working on the program seven years ago and it’s been a thrill to watch it grow over the years. Recently, I was given the opportunity to speak at TEDActive about the origins of NORAD Tracks Santa and how Google has brought this to life in Google Earth.
I’d like to thank all of Santa’s “elves” that helped out across Google and NORAD far and wide. Happy Holidays!Friday, 23 December 2011
Special request for Santa

Thursday, 22 December 2011
Javascript coverage analysis tool
The open source release of a Javascript coverage analysis tool called ScriptCover. It is a Chrome extension that provides line-by-line Javascript code coverage statistics for web pages in real time without user modification of the site. Results are collected when the page loads and continue to be updated as users interact with the page. These results can be viewed in real time through a reporting tool which highlights the executed lines of code for detailed analysis. ScriptCover is useful when performing manual and automated testing and in understanding and debugging complex code.


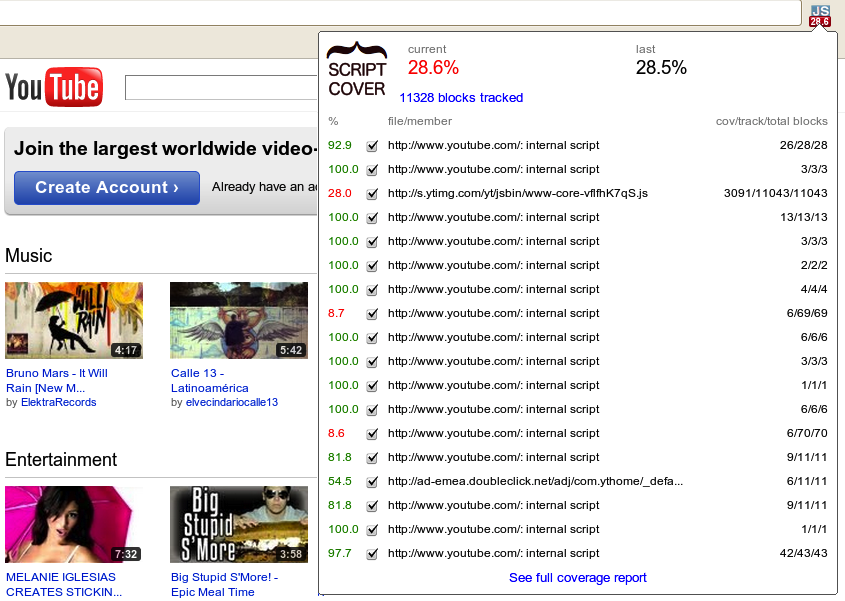
Short report in Chrome extension popup, detailing both overall scores and per-script coverage.

Sample of annotated source code from the detailed report. First two columns are line number and number of times each instruction has been executed.
We envision many potential features and improvements for ScriptCover, e.g.:
- support other coverage metrics, e.g. path coverage and condition coverage
- support richer reports and exporting to HTML and XML
- submit Javascript coverage statistics to a server and analyze combined statistics for selected users, dates, etc.
- map user actions to related Javascript code
Want to get involved with ScriptCover and make it better? Join the team! To get started, visit our project page, join the community, read documentation and download the code.
Thursday, 15 December 2011
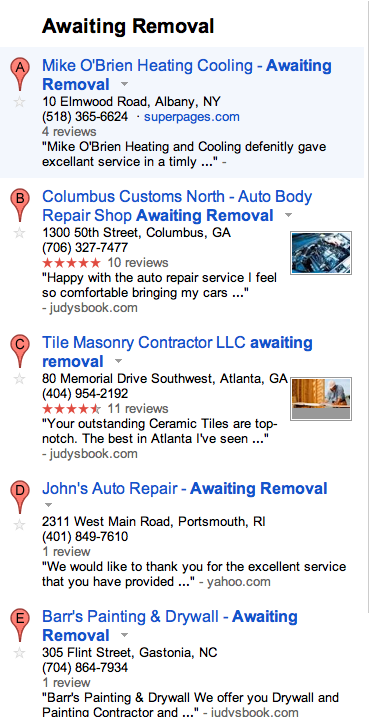
Google Places Adds New Features
Over the past week or so a number of new features have cropped up Places Pages that solicit user input in an effort to improve the quality of Places results. Google noted that “We’re doing different experiments like that on Maps to verify data is correct and up to date”.
With the exception of the image vote, these new user inputs appear to surface on a somewhat random basis and although they could be related to trust issues, I don’t think they are. Another point of interest is that with the multiple choice answers, the user is given a range of choices that go from positive to negative. It appears that the method in which they are implemented attempts to minimize the ability to game them by evil doers.
Clearly, user generated input has in the past been used to abuse listings in Places and there are plenty of other ways that could be used to triangulate a record’s accuracy via 3rd party sources. Even though it appears that Google has recently upped the ante on that front the question remains as to why Google is again increasing the ability of users to provide input when many recent efforts have gone so wrong. Chris Silver Smith points out that Google has never really prioritized the business owner as the definite source for information.
Google’s comments not withstanding, these new inputs do not appear to be experiments (unless of course you consider Places a big experiment). It does seem to be a renewed effort by Google to gather more user generated input as to the accuracy around a Place.
In theory, despite past abuses, user generated input is cheap and potentially valuable source of current information. The question with these new implementations is whether Google has put in place reasonable safeguards and adequate processes to actually improve the overall quality of the index WITHOUT punishing innocent businesses. Time will tell.
| Ability to critique the location accuracy was spotted by Daniel Hollerung and reported by Chris Silver Smith. |  |
| The ability to vote an owner uploaded photo up or down was noted by Gav Heppinstall last week. |  |
| The option for a user to provide input as to whether a website is correct regardless of whether of the record has been claimed was first seen late last week and reported out by Matt Siltala yesterday. |  |
Follow Your World
Ever since was launched the English version of Follow Your World earlier this year, users around the globe have been able to receive email notifications whenever imagery of locations they care about are updated in Google Maps and Google Earth.
We’re happy to announce the expansion of this tool. We’ve localized the software into 43 additional languages so that the application can easily be accessed by millions more people around the world.
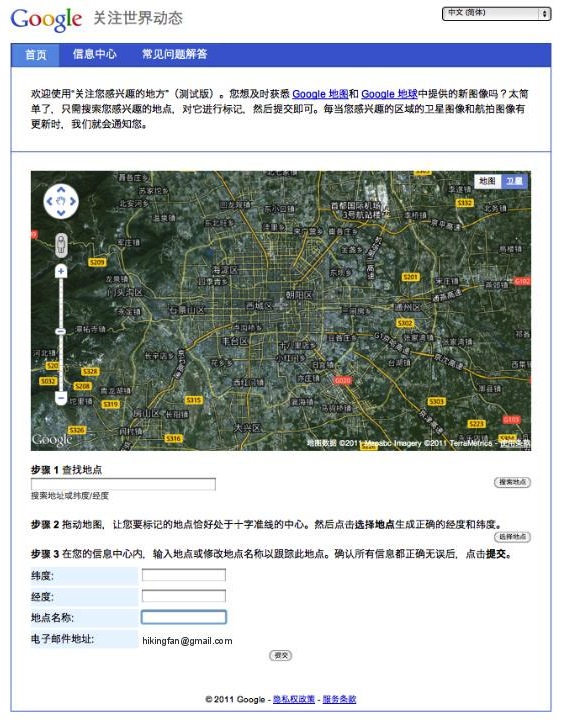
Simply use the app to indicate areas around the world that interest you - be they your current neighborhood, college town, or dream vacation spot - and receive an email update whenever new satellite or aerial imagery for those places are added to Maps and Earth.
 Follow Your World: now in Chinese and 43 other languages
Follow Your World is now available for users of the following languages:
Arabic, Basque, Bulgarian, Catalan, Chinese (Simplified), Chinese (Traditional), Croatian, Czech, Danish, Dutch, English, English (UK), Estonian, Farsi, Finnish, French, Galician, German, Greek, Hebrew, Hindi, Hungarian, Indonesian, Italian, Japanese, Korean, Latvian, Lithuanian, Norwegian, Polish, Portuguese (Brazil), Portuguese (Portugal), Romanian, Russian, Serbian, Slovak, Slovenian, Spanish (Spain), Spanish (Latin America), Swedish, Thai, Turkish, Ukrainian and Vietnamese
Follow Your World: now in Chinese and 43 other languages
Follow Your World is now available for users of the following languages:
Arabic, Basque, Bulgarian, Catalan, Chinese (Simplified), Chinese (Traditional), Croatian, Czech, Danish, Dutch, English, English (UK), Estonian, Farsi, Finnish, French, Galician, German, Greek, Hebrew, Hindi, Hungarian, Indonesian, Italian, Japanese, Korean, Latvian, Lithuanian, Norwegian, Polish, Portuguese (Brazil), Portuguese (Portugal), Romanian, Russian, Serbian, Slovak, Slovenian, Spanish (Spain), Spanish (Latin America), Swedish, Thai, Turkish, Ukrainian and Vietnamese
Wednesday, 14 December 2011
Google Currents
We strive to give you beautiful and simple ways to experience all the content the web has to offer, such as sharing photos on Google+, watching YouTube videos and discovering books, movies and music from Android Market. Today we’re expanding our content offering with the introduction of Google Currents, a new application for Android devices, iPads and iPhones that lets you explore online magazines and other content with the swipe of a finger.
We’ve worked with more than 150 publishing partners to offer full-length articles from more than 180 editions including CNET, AllThingsD, Forbes, Saveur, PBS, Huffington Post, Fast Company and more. Content is optimized for smartphones and tablets, allowing you to intuitively navigate between words, pictures and video on large and small screens alike, even if you’re offline.
To get started, simply download the app and choose the publications you want to subscribe to for free. You can also add RSS, video and photo feeds, public Google+ streams and Google Reader subscriptions you’re already following. In addition to consuming your favorite media, you can also use the trending tab to discover related content that matches your tastes.
Ready for publishers
Alongside Google Currents, we’re also launching a self-service platform that gives publishers the flexibility to design, brand and customize their web content. For example, if you’re a small regional news outlet, a non-profit organization without access to a mobile development team, or a national TV network with web content, you can effortlessly create hands-on digital publications for Google Currents.

Great content needs a great audience, which is why Google Currents is integrated with Google+ so users can share articles or videos they’ve enjoyed with their circles. Publishers can also associate their account with Google Analytics in order to increase their awareness of consumers’ content preferences, device use and geographic distribution.
Google Currents is now available for download in Android Market and the Apple App Store for US users. Whether you’re a reader or a publisher, we hope that Google Currents helps you easily experience the best content on the web. Try it here now and stay tuned for more to come.
Tuesday, 13 December 2011
Hacking the world
Every year, coders and designers have been gathering to meet with experts in disaster response and international development, to spend a weekend designing tools and hacking code for the public good. This weekend, December 3-4, 2011, the next Random Hacks of Kindness (RHoK) hackathons will be taking place in cities around the world, with the simple idea that technology can and should be used for good.
 Led by Google, Microsoft, Yahoo!, Hewlett-Packard, NASA, and the World Bank, RHoK brings together hackers of all stripes to create open source software solutions that address issues of global interest and assist the organizations working on those issues. The fourth round of global RHoK events will be taking place in more than 30 cities on December 3-4, 2011, and you are invited and encouraged to attend.
Some of the interesting solutions that have been developed at past events include I’mOK, a mobile app that was used after the Haiti and Chile earthquakes, CHASM, a visualization tool for mapping landslide risk which is being used by the World Bank around the Caribbean, and Bushfire Connect, an online service for real-time information on fires in Australia. Hackers have also helped develop features for Person Finder, a tool created by the Google.org Crisis Response Team to help people find friends and loved ones after disasters.
We’re inviting all developers, designers, and anyone else who wants to help “hack for humanity” to attend one of the local events this weekend, December 3-4. You’ll have a chance to meet other open source developers, work with experts in disasters and international development, and contribute code to exciting projects that make a difference. Googlers will be attending several events, including those in San Francisco, New York, London, and others. We look forward to meeting you there!
And if you’re part of an organization that works in the fields of crisis response, climate change, or international development, you can submit a problem definition online, so that developers and volunteers can work on technology to address the challenge.
Visit http://www.rhok.org/ for more information and to sign up for your local event, and get set to put your hacking skills to good use.
Led by Google, Microsoft, Yahoo!, Hewlett-Packard, NASA, and the World Bank, RHoK brings together hackers of all stripes to create open source software solutions that address issues of global interest and assist the organizations working on those issues. The fourth round of global RHoK events will be taking place in more than 30 cities on December 3-4, 2011, and you are invited and encouraged to attend.
Some of the interesting solutions that have been developed at past events include I’mOK, a mobile app that was used after the Haiti and Chile earthquakes, CHASM, a visualization tool for mapping landslide risk which is being used by the World Bank around the Caribbean, and Bushfire Connect, an online service for real-time information on fires in Australia. Hackers have also helped develop features for Person Finder, a tool created by the Google.org Crisis Response Team to help people find friends and loved ones after disasters.
We’re inviting all developers, designers, and anyone else who wants to help “hack for humanity” to attend one of the local events this weekend, December 3-4. You’ll have a chance to meet other open source developers, work with experts in disasters and international development, and contribute code to exciting projects that make a difference. Googlers will be attending several events, including those in San Francisco, New York, London, and others. We look forward to meeting you there!
And if you’re part of an organization that works in the fields of crisis response, climate change, or international development, you can submit a problem definition online, so that developers and volunteers can work on technology to address the challenge.
Visit http://www.rhok.org/ for more information and to sign up for your local event, and get set to put your hacking skills to good use.
Friday, 9 December 2011
The Lord Mayor's Show 2011
Sometimes you walk to the end of lab, here in CASA, get introduced to a visitor and have to take a step back at the resulting demo. Yesterday i had the pleasure of meeting Tobias Franke of the University of Passau's Embedded System Lab who is part of a team looking at realtime crowd densities. Tobias has run a trial during the 2011 Lord Mayor's Show in London. The "hotter" (i.e. red) the blobs are, the denser the crowd was at that location, the resulting visualisation is impressive:
Crowd Density at the Lord Mayor's Show 2011 (London, UK) from Tobias Franke on Vimeo.
The data was been gathered by a smartphone application collecting live sensor data from users. The heatmap and the corresponding visualization was realised by Martin Wirtz of the ETH Zurich's Wearable Computing Lab with Prof. Eve Mitleton-Kelly (director of the Complexity Group at the London School of Economics) involved in the development as policy maker. The overall system allows emergency services to gain an almost-live insight into the crowd density at large scale events. The software has been developed as a part of the Socionical research project (for more information see socionical.eu), in short we were impressed at the real time crowd viz via a smart phone app...
Tuesday, 6 December 2011
Google Geo User Summit in Barcelona
Settled between the Catalan Coastal range and Mediterranean sea, the city of Barcelona is home to an array of culinary treasures, iconic architecture, endless museums and beaches, and the impressive FC Barcelona football stadium. The city’s distinctive mix of tradition and innovation thus proved the ideal host to the Google Geo User Summit Barcelona. From October 12th-14th, Google Map Maker, Google SketchUp and Building Maker, and Panoramio welcomed some of our most passionate mappers, 3D modelers and Panoramio photographers across Europe and the Middle East to celebrate their invaluable contributions to an ever-growing Geo Community.


View of Barcelona from Museu Nacional D’art de Catalunya by Matthew Walters, Panoramio contributor
The summit was an exciting opportunity for many of our top contributors to share their geographic crowd-sourced efforts, work directly with Google engineers to brainstorm potential new product features, and set strategies for improving the overall Geo community. Attendees also had a chance to mind-meld with our product leaders during a day of unconference sessions, sharing thoughts, ideas, and stories about their experiences that will help us to improve our products.
Following a keynote address by Aidan Chopra, Google Geo Evangelist, attendees shared their inspiring projects and practices with a rapt audience. We learned from Levan Beruchashvili how the National Agency of Public Registry helped map the entire country of Georgia for its recent graduation to Google Maps. Arek Pawlowski described hosting multiple SketchUp workshops at his university, creating almost 450 models in an ongoing effort to put all of Toruń, Poland into 3D. As it is the user-generated content that fuels the Google Geo products, these and other contributor testimonials stood out as the highlight of the summit.
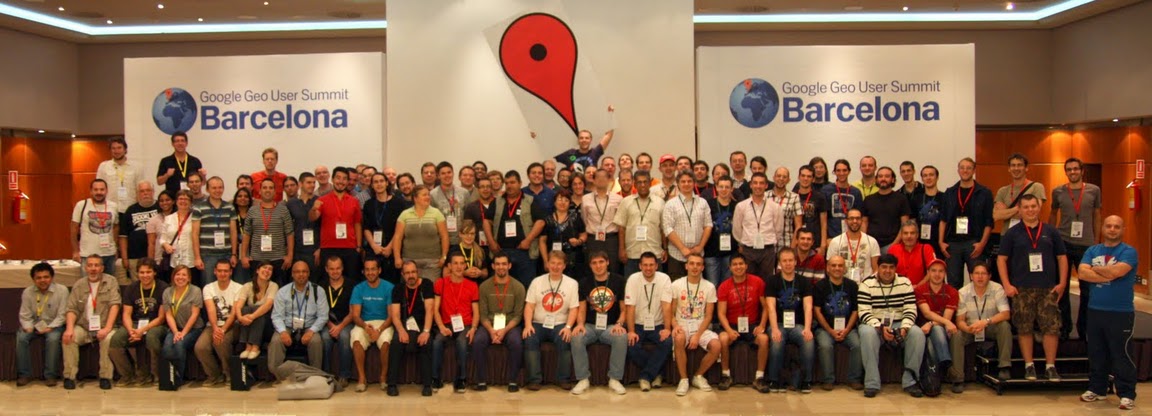
Attendees at the Google Geo User Summit Barcelona!
To learn more about the Google Geo User Summit Barcelona, visit the event website, where you can browse photographs of the conference and its beautiful setting along the Mediterranean coast. Extensive session notes and user presentations are also available. If you’re interested in attending future events, please see the Map Maker Events Calendar, 3D Events Calendar and Panoramio Events Calendar. This summit was one exciting part of an ongoing celebration of the passionate mappers, modelers, and photo contributors who are improving Google Maps and Google Earth for the world to share.
Monday, 5 December 2011
Locals In the Spotlight
 In May, Linda Buquet reported on what turned out to be apparent sabotage of Places business listings by the local search firm 411Local. Here is a recent screen shot of a search in Maps still showing the Places listing defacements.
Well 411Local is back in the spotlight today. This post appeared in the Google Places Forums:
In May, Linda Buquet reported on what turned out to be apparent sabotage of Places business listings by the local search firm 411Local. Here is a recent screen shot of a search in Maps still showing the Places listing defacements.
Well 411Local is back in the spotlight today. This post appeared in the Google Places Forums:
| 411locals is threatening to remove my places account |
|
vbluguitar
Level 1
10/24/11
|
Topic of your question (reviews, categories, duplicate listing, etc.): I have been getting call from 411 locals threatening to remove my places page.
Your business name as it is in your Google Places account:ArtKat Photography
Your business type/category (e.g. photographer, hospital, etc.): Photography
URL(s) if applicable:www.artkatphotography.com
Update:
2 years ago I did a 1 month trial with 411locals.net. They got everything wrong and I cancelled after 1 month of service. Since then I have made many updates to my places account and now, 2 years later, 411locals is calling and telling me “we have been updating your account and if you don’t sign up again we will remove it” Since I maintain it myself, I know this is not the case, but they have my PIN so I am afraid of the damage they will do to my places page.
Google Apps highlights- end of October
Google presentations reloaded
On Tuesday Google launched a completely rebuilt version of our web-based presentations application, so you can build more beautiful presentations together with colleagues and classmates. Google presentations now lets you make great-looking slides with animated builds, advanced slide transitions and better support for drawings, tables and themes. Plus, we made it easier to create presentations with others, without the hassles of attachments. Your whole team can work together in the same version of a presentation at the same time, and you can see who’s doing what, chat with others, and see a full revision history at any moment in time.
 Google Docs on Android tablets
They’ve made it faster and easier to work with Google Docs on Android tablets with a new version of the Android application that takes full advantage of larger screen real estate. The three-panel view lets you browse filters and collections, see your document list and view file thumbnails and details simultaneously. You can get the Google Docs Android app for free from the Android Market.
Google Docs on Android tablets
They’ve made it faster and easier to work with Google Docs on Android tablets with a new version of the Android application that takes full advantage of larger screen real estate. The three-panel view lets you browse filters and collections, see your document list and view file thumbnails and details simultaneously. You can get the Google Docs Android app for free from the Android Market.
 Charts in Google Sites
Charts are often created in spreadsheets, but sometimes you want charts to appear in other places, like your team or project sites. In Google Sites, now you can select “Chart” from the “Insert” menu, and navigate to the Google Spreadsheet where your chart or data is located. You can also choose to have your site’s chart update in real-time when someone updates the underlying spreadsheet.
Charts in Google Sites
Charts are often created in spreadsheets, but sometimes you want charts to appear in other places, like your team or project sites. In Google Sites, now you can select “Chart” from the “Insert” menu, and navigate to the Google Spreadsheet where your chart or data is located. You can also choose to have your site’s chart update in real-time when someone updates the underlying spreadsheet.
 New look for Google Docs and Sites
We started rolling out a new look in Google Docs a couple months ago, and now this new design is available throughout all our collaboration tools. In addition to a cleaner, simpler design, we’ve made it more clear when your files are being auto-saved and added new icons to help you see at-a-glance who your docs are shared with. You can also customize the overall “density” of screen information, a great feature if you want to fit more onto a smaller display.
New look for Google Docs and Sites
We started rolling out a new look in Google Docs a couple months ago, and now this new design is available throughout all our collaboration tools. In addition to a cleaner, simpler design, we’ve made it more clear when your files are being auto-saved and added new icons to help you see at-a-glance who your docs are shared with. You can also customize the overall “density” of screen information, a great feature if you want to fit more onto a smaller display.
 Who’s gone Google?
Successful small businesses tend to stay laser-focused on improving their core businesses, without getting distracted by peripheral activities that don’t make them more competitive. For example, most small businesses don’t want to spend time or money developing in-house expertise to run email and other IT systems. Case in point: 97 percent of Business Insider’s “Silicon Valley Startups to Watch” use Google Apps.
More than 5,000 businesses and thousands of other organizations start using Google Apps every single day, and more of our customers have shared their stories recently so you can hear why. A warm welcome goes out to Philz Coffee, Mid-Atlantic Door Group, Bradford & Barthel, LLP and the City of Mesquite, Nevada.
Who’s gone Google?
Successful small businesses tend to stay laser-focused on improving their core businesses, without getting distracted by peripheral activities that don’t make them more competitive. For example, most small businesses don’t want to spend time or money developing in-house expertise to run email and other IT systems. Case in point: 97 percent of Business Insider’s “Silicon Valley Startups to Watch” use Google Apps.
More than 5,000 businesses and thousands of other organizations start using Google Apps every single day, and more of our customers have shared their stories recently so you can hear why. A warm welcome goes out to Philz Coffee, Mid-Atlantic Door Group, Bradford & Barthel, LLP and the City of Mesquite, Nevada.


Sunday, 4 December 2011
DoubleClick for Publishers API
The DoubleClick for Publishers API team is excited to announce our first Google+ Hangout Office Hours session on December 7th at 2pm Eastern (11am Pacific). Across the Google Developer Relations team we have seen tremendous positive feedback regarding these Hangouts and we are looking forward to opening a new channel for our developers to converse and ask questions about the API. Specifically, the DFP API team is interested in understanding how you, our developers, use the API so we can continue to improve it.
 The Office Hours will be run in a question-and-answer format so please bring your questions about the DFP API and the DFP Upgrade. Let us know you’re planning to attend by clicking the “I’ll be there” button on the developers.google.com page for this event.
Just a few housekeeping items to remember:
The Office Hours will be run in a question-and-answer format so please bring your questions about the DFP API and the DFP Upgrade. Let us know you’re planning to attend by clicking the “I’ll be there” button on the developers.google.com page for this event.
Just a few housekeeping items to remember:
- If you have a particularly complicated question we ask that you send it to us ahead of time by adding it to this forum post.
- To join the hangout you’ll need to have a Google+ account (sign up here) and the Google voice and video plugin installed (download available for Windows, Mac, and Linux).
- Hangouts are currently limited to ten people at a time, so if you aren’t able to join right away please try again later in the hour as a slot may have opened up.
- Additional information about Hangouts is available in the Google+ Help Center.
Thursday, 1 December 2011
Google Earth: Imagery Update at the end of November
The winter and holiday seasons are quickly approaching but that hasn’t stopped the Google Earth and Maps Imagery Team from updating aerial and satellite imagery throughout the globe. Today, we’d like to share several interesting features identified in this latest release.
The first example shown below is part of an aerial image acquired this past September of the ski slopes in Breckenridge, Colorado. The slopes have already accumulated several inches of snow over the past few weeks and although it’s still very early in the ski season, a third of all ski lifts are now open! If you can’t make it to the mountains quite yet, be sure to experience the next best thing with Street View imagery from some of the most popular ski destinations.


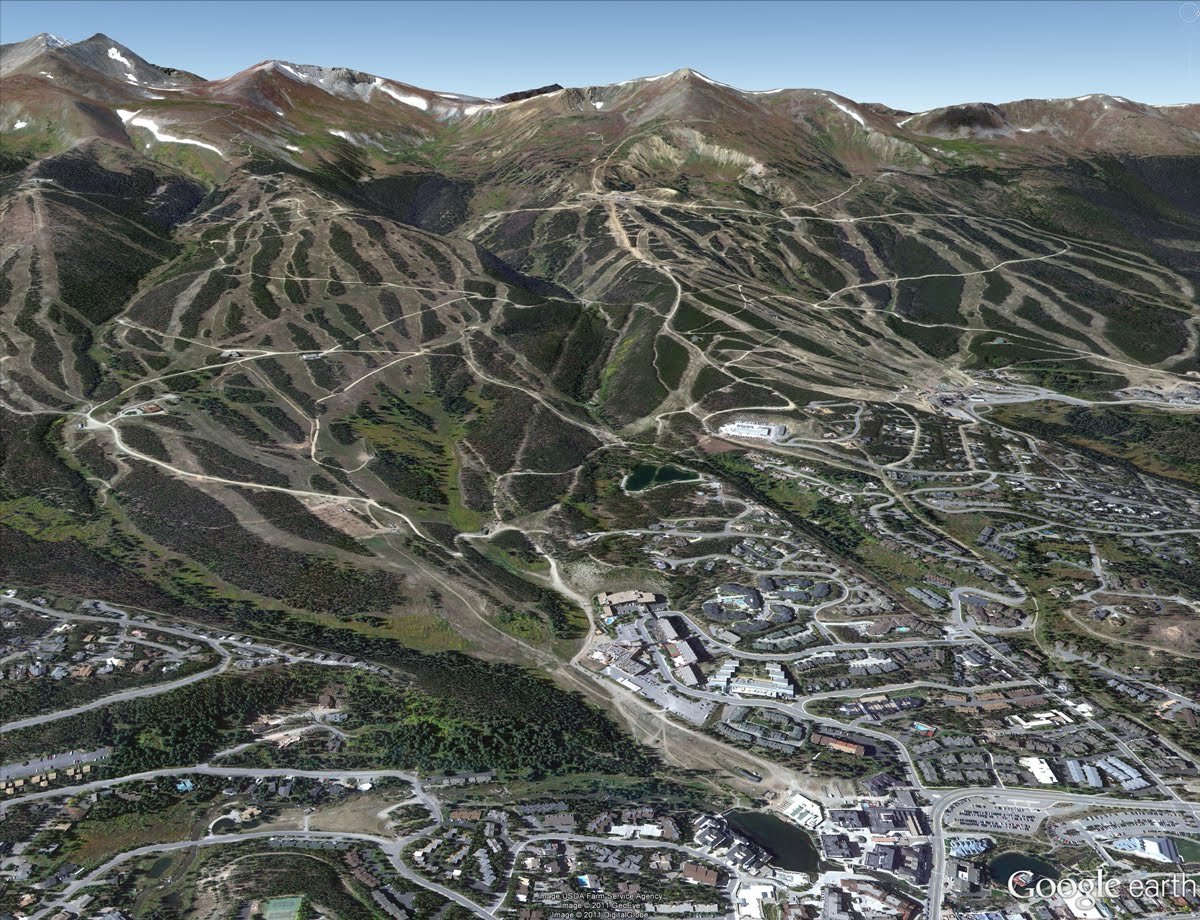
Perspective view of ski slopes in Breckenridge, Colorado
Philadelphia, Pennsylvania is full of iconic landmarks from American history. The aerial image shown below, which was acquired this past October, shows some of the most well known buildings along the east bank of the Schuylkill River. At the bottom left of the image are the fifteen structures comprising Boathouse Row, and the upper right shows the Fairmount Water Works and the Philadelphia Museum of Art. In the far right corner of the image are the stone steps made famous in the Rocky movies.

Boathouse Row, Fairmount Water Works and the Philadelphia Museum of Art, Philadelphia, Pennsylvania
“X” marks the spot in the satellite image below of part of Miramar, Argentina. Of course, the feature is comprised of roads that lead to the town’s central sculpture, Monumento al Gral Alvarado, and the four parks comprising the central plaza.

Miramar, Argentina
As we close in on the Christmas season, it seems appropriate to feature several well known churches that have been updated with new imagery. The first example, shown below, is aerial imagery of the Basilica of the Assumption of the Blessed Virgin Mary, in Gdańsk, Poland. The structure is considered one of the largest Brick Gothic buildings ever constructed, and has sufficient space to hold 25,000 people!
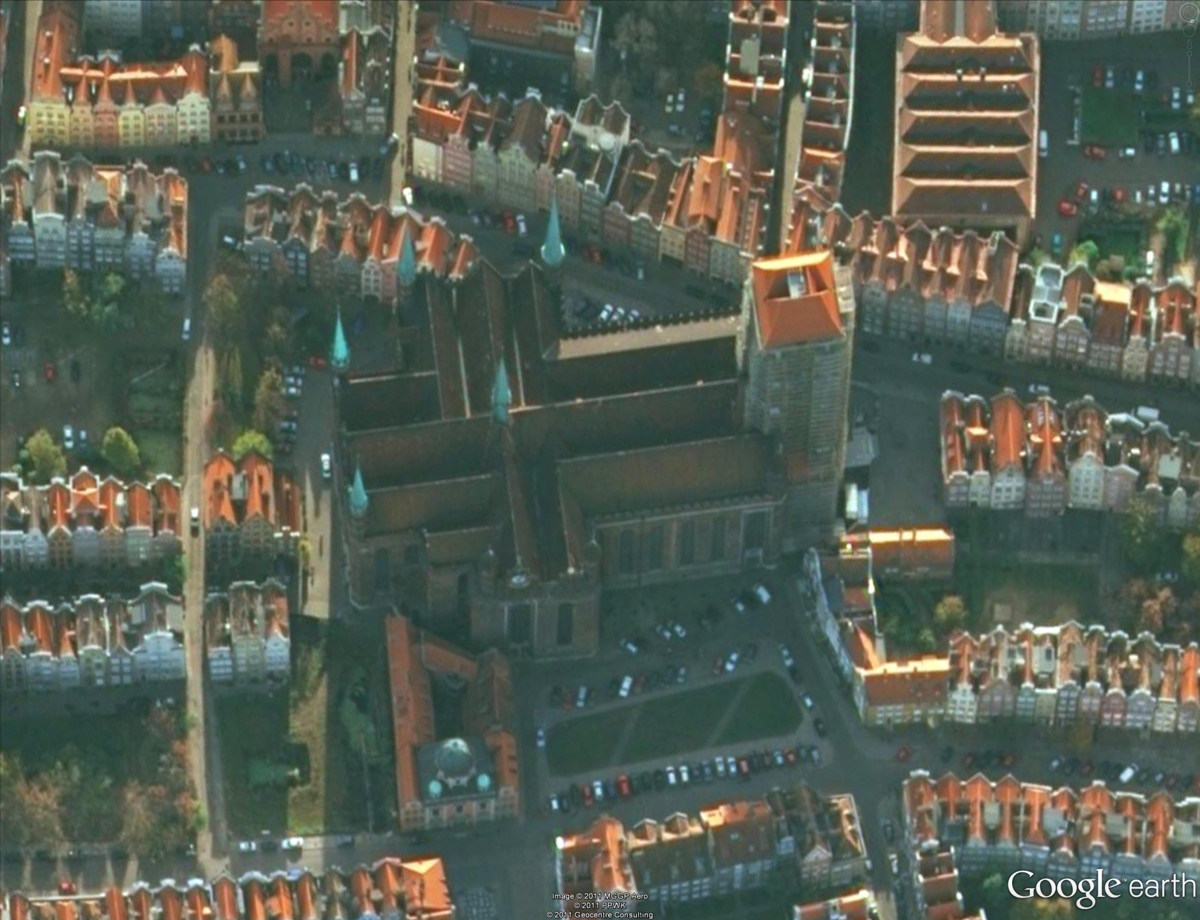
Basilica of the Assumption of the Blessed Virgin Mary, Gdańsk, Poland
This next example shows updated aerial imagery of Burgos, Spain. In the upper left, is the Burgos Castle, overlooking the Burgos Cathedral in the lower right. This cathedral is famous for its vast size and unique French Gothic architecture.
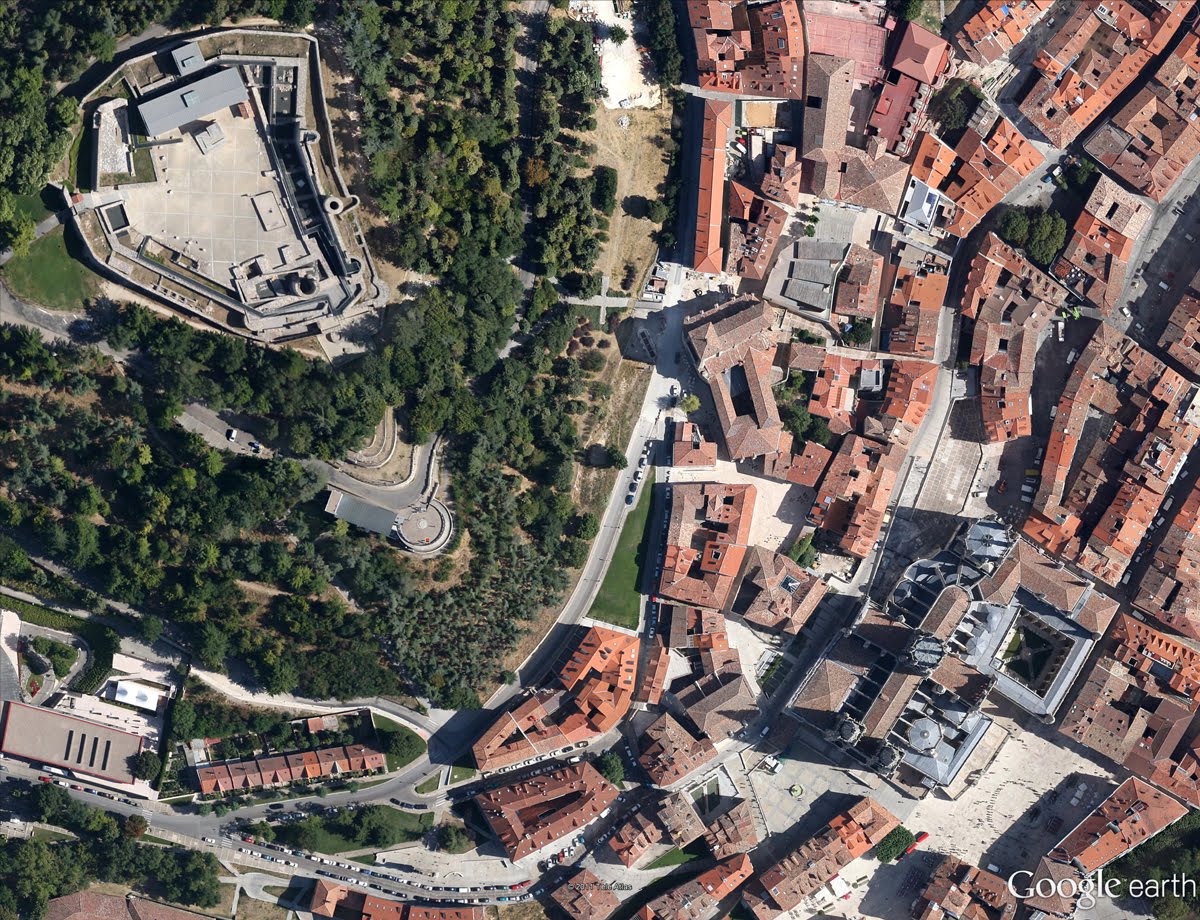
Burgos, Spain
Finally, below is an updated image of the Calvary Baptist Church of Hi Vista, California, perhaps one of the more notable churches of late. This church was of course used famously in the Kill Bill Vol. I movie as the site of near demise for the heroine, “The Bride.”
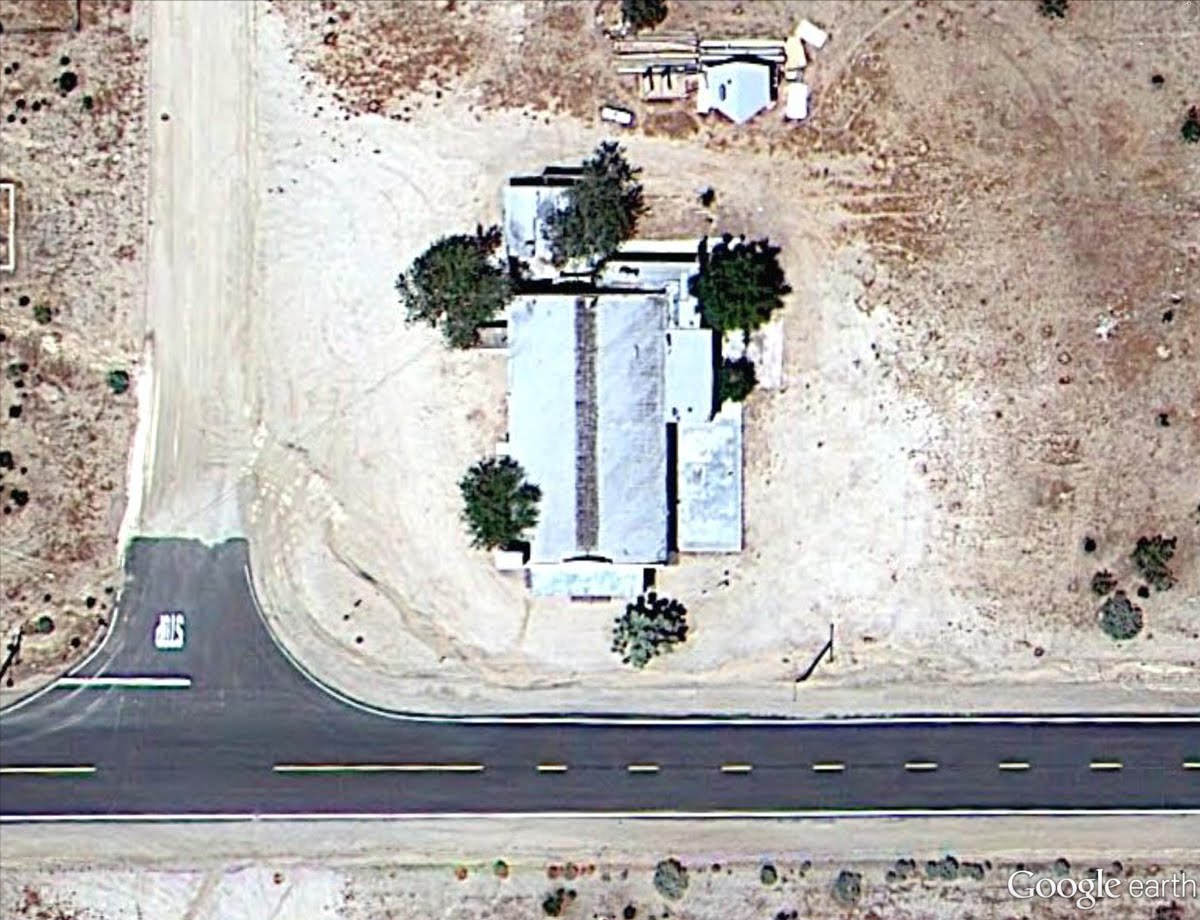
Calvary Baptist Church, Hi Vista, California
If you’d like to receive an email notification when the Google Earth and Maps Imagery team updates your favorite site(s), we’ve got just the tool: The Follow Your World application!
These are only a few examples of the types of features that can be seen and discovered in our latest batch of published imagery. Happy exploring!
High resolution aerial updates:
USA: Alamosa, CO; Albany, NY; Altoona, PA; Atlanta, GA; Bartlesville, OK; Bishop, CA; Boise City, OK; Clarksville, TN; Clayton, NM; Edwards, CA; Erie, PA; Georgetown, SC; Great Bend, KS; Guymon, OK; Hot Springs, AR; Lamar, CO; Lawton, OK; Llano, TX; McAlester, OK; Merced, CA; Oklahoma City, OK; Palmdale, CA; Philadelphia, PA; Redding, CA; Roseburg, OR; Scranton, PA; Springfield, MO; Texarkana, TX; Twin Falls, ID; Vail, CO
Poland: Bielsko-Biala, Lubaczowski, Malborski, Mazowieckie, Mielecki, Wolowski, Wolczyn,
Spain: Burgos
Switzerland: Horgen
Countries/regions receiving high resolution satellite updates:
Algeria, Argentina, Australia, Austria, Bangladesh, Belarus, Benin, Bhutan, Bolivia, Botswana, Brazil, Bulgaria, Burkina Faso, Burundi, Cameroon, Canada, Cape Verde, Central African Republic, Chad, Chile, China, Colombia, Comoros, Costa Rica, Croatia, Cuba, Cyprus, Czech Republic, Côte d'Ivoire, Democratic Republic of the Congo, Djibouti, Dominican Republic, Ecuador, Egypt, Eritrea, Ethiopia, Finland, France, French Polynesia, Germany, Ghana, Greece, Greenland, Guatemala, Guinea, Haiti, Honduras, Hungary, India, Indonesia, Iran, Ireland, Italy, Japan, Jordan, Kazakhstan, Kenya, Kuwait, Lesotho, Libya, Madagascar, Malawi, Marshall Islands, Mexico, Mongolia, Morocco, Mozambique, Myanmar, Namibia, Nepal, New Zealand, Niger, Nigeria, North Korea, Oman, Pakistan, Papua New Guinea, Paraguay, Peru, Philippines, Poland, Portugal, Qatar, Republic of Korea, Romania, Russia, Rwanda, Saudi Arabia, Senegal, Serbia, Sierra Leone, Slovakia, Somalia, South Africa, Spain, Sri Lanka, Sudan, Svalbard, Swaziland, Sweden, Switzerland, Syria, Tajikistan, Tanzania, Thailand, Togo, Tunisia, Turkey, Uganda, Ukraine, United Arab Emirates, United Kingdom, United States, Uruguay, Uzbekistan, Venezuela, Vietnam, West Bank, Yemen, Zambia, Zimbabwe
Subscribe to:
Posts (Atom)