The concept of four-dimensional spacetime was challenged recently by a group of scientists who argue that time, in itself, is not a fundamental entity – it is merely a measure of the numerical order of changes in space. Nevertheless, whether dimension or not, time is a crucial factor to consider when interpreting spatial data. We not only need to know where something is, but when it was there.
Time and Maps
One common question asked on the MSDN Bing Maps forum concerns the timeliness of the base map data (particularly that of aerial photographic imagery) – “When was this image taken?” and “When will it next be refreshed?”. “Why isn’t this new building being shown or this recent housing development included?” etc. In many cases, as in the motivation behind these types of questions, we expect a map to display a single, most up-to-date current view of an area. However, this isn’t always the case. On occasions, we want to be able to navigate and explore a map both spatially and temporally – north, south, east, west, yesterday, and tomorrow; back into history and forwards into the future.In fact, we all see and interpret this sort of time-dependent spatial data on a daily basis in the form of the weather forecast. I want to know what the weather will be like in Norwich at 3:00pm tomorrow:
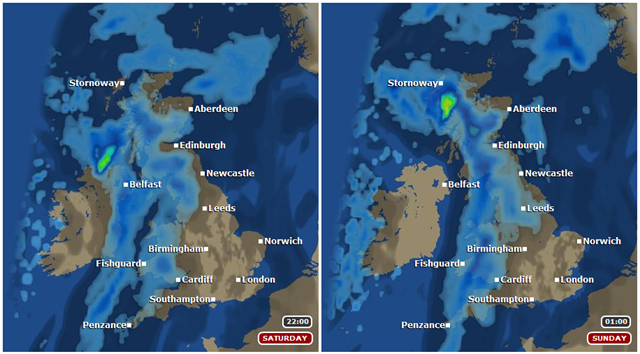
In a static display medium, such as a newspaper, maps representing changing data over a period in time are generally shown as a series in a panel-display like that above. But what would be the best way to display changing time-based data on an interactive medium, such as Microsoft Bing Maps or Google Maps?
The most obvious method would be to have some sort of dynamic tilelayer – the background image of the map– that could be refreshed and updated, either on a scheduled interval or via some user control. Before writing this article I had a quick look (using a popular internet search providerTM) to see if any library already existed to provide this functionality. There are a number of javascript libraries around that deal with timeline-based javascript animation, including Mashi and $fx. However, these tend to create animated effects by gradually-changing CSS styles affecting the position or opacity of existing elements. But to have a dynamic Bing Maps tilelayer we don’t want to change the style of the image elements on the page – we need to change the underlying images themselves.
So, having been unable to find any existing libraries or other resources on the topic, I started experimenting myself. In this first post of a series on the subject of creating dynamic maps, I’ll look at the most basic implementation of an animated tilelayer, which is…
Animated GIFs (or, flashback to the Internet circa. 1995)
Let’s start with the basics: to create a new tile layer in Bing Maps, you call the TileLayer constructor method specifying four properties of the tile layer in the supplied TileLayerOptions parameter: tile source, opacity, visible, and zIndex. Like this:var tileOptions = {
mercator: new Microsoft.Maps.TileSource({ uriConstructor: http://mapsys.info/wp-content/uploads/2011/05/156a2bebacadkey.png.png }),
opacity: 0.3,
visible: true,
zIndex: 25
};
var tilelayer = new Microsoft.Maps.TileLayer(tileOptions);Animated GIFs got a bad reputation through their massive overuse on the internet to create irritating animations such as this:

Certainly, it’s been a very long time since I’ve tried to use GIFs in almost any context: the many negatives associated with the GIF file format include that it is a proprietary format which generally leads to large file sizes but with only limited 8-bit colour depth, and only basic support for transparency. In almost all circumstances, PNG or JPG is a better choice of images on the internet. However, among all the commonly-used image formats – JPG, PNG, TIF, BMP, etc. – GIF files are still the only image format that supports multiple frames of animation and are widely supported across all browsers. So maybe we shouldn’t rule them out completely…
Creating an Animated Weather Map
Having established weather forecast maps as a recognisable and very practical example of the presentation of time-based spatial data (and also one for which sample data was readily available from the NOAA), I decided to use this as the example on which to base my application. To begin with, I wrote a PHP script that connected to the NOAA radar web service and downloaded radar imagery for the whole of the contiguous U.S., like this: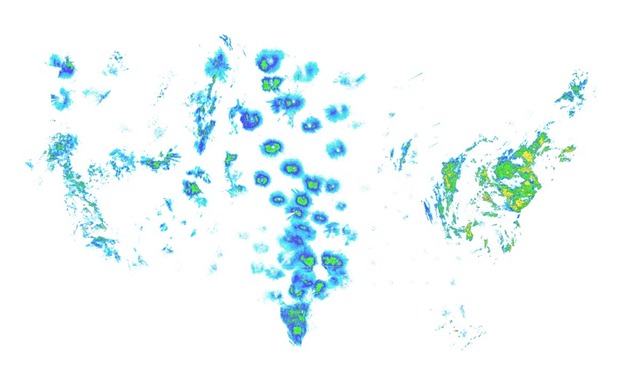
To put this image in context, here it is again overlaid directly onto a Bing Maps base map:
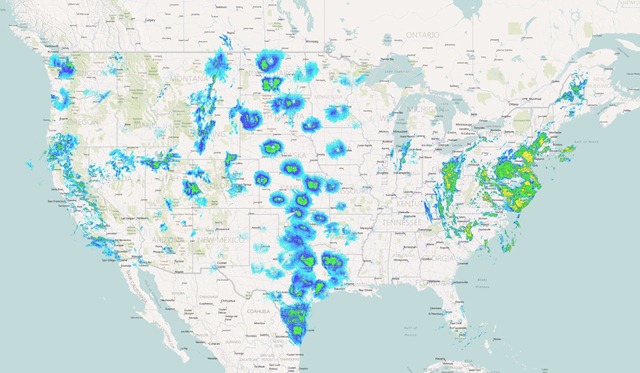
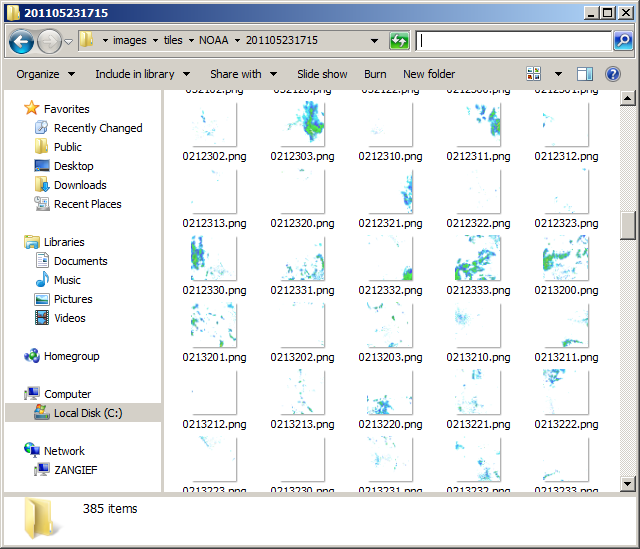
I set up a cron job to call this PHP script every 15 minutes, and stored the results returned from the web service to build up a repository of images across a period of time. Then I cut each image up into a set of 256px x 256px tiles that matched the Bing Maps quadkey tiling system. After three hours passed, I had a set of 12 timestamped folders, each of which contained 385 tiles (I created tiles at zoom levels 5, 6, and 7 across the mainland U.S.), much like this:
Then, using the GIFEncoder class which can be found as part of the PHP Video Toolkit project, I looped through each folder and created a set of animated GIFs displaying the radar measurements for each tile over the last three hours. The following tile, for example, shows tile 021323 for the period 13:00 – 16:00 on 17th May 2011:
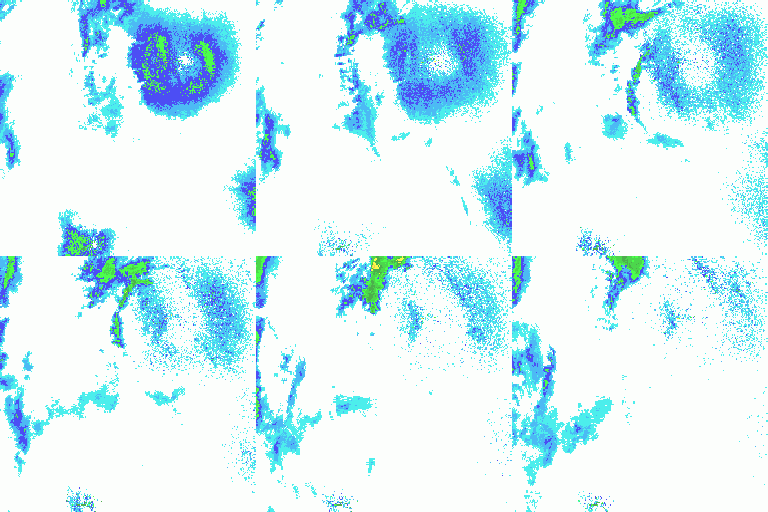
Then, by creating a tilelayer with a tilesource pointing to the location of my repository of animated GIF images, I was able to get a first shot at an animated weather map. Sadly, WordPress won’t let me insert an iframe or javascript here to show the finished product, but here’s a short video clip that demonstrates me navigating around the map as it refreshes:
And, you can try it online, here: http://www.a3uk.com/bingmaps/demos/animatedgiftilelayer/
The advantages of using animated GIFs are:
- Very easy to set up
- Supported across most browsers, with little additional processing required by the client
- Once each tile is fully downloaded to the client, it can be cached
- GIF files can be created dynamically on the server
- Each individual GIF tile may be of considerable size – the single 256px x 256px tile above containing 18 frames of animation is 109kB. No frame can be displayed until the entire image for that tile has finished downloading.
- The animation cannot be controlled by the client at all – the duration between frames, the looping behaviour etc. is all pre-baked into the GIF file, and there is no way to stop, rewind, restart, or speed up the framerate, for example.
- There is no way (other than perhaps displaying a tiny timecode in the corner of every tile) to know what time period is represented by the frame currently being viewed.
- Each tile is completely independent, and is downloaded and animated separately from the others. The animation for each tile begins as soon as that particular tile image is loaded in the browser, so the animation of tiles in any given map view can become out-of-sync with each other.

No comments:
Post a Comment