Sunday 31 July 2011

Bing Maps Hybrid Imagery Style Generation


If you’ve examined the tile requests that Bing Maps makes using Fiddler, Firebug, or similar, you’ve probably seen that every tile request has a parameter, g, which represents the generation of the tile.

For example, the URL http://ecn.t2.tiles.virtualearth.net/tiles/h120200223312?g=671 requests the 671 generation hybrid map style (that’s the “h” prefix on the filename) tile at quadkey 120200223312. Until this morning, that would give you the following image:

image

However, at some point today it seems that Microsoft have decided to roll out a new generation (g=700) of map tiles, which particularly affects the hybrid (aerial + label) style. All requests made from http://www.bing.com/maps now append the g=700 parameter onto the end, so the latest version of the hybrid map tile for the above quadkey is now http://ecn.t2.tiles.virtualearth.net/tiles/h120200223312?g=700, as shown below:

image

Now, what if you don’t like the new “lavender” labelling style used in generation 700 tiles? No problem, you might think – surely that’s the point of versioning each tile generation… if you don’t want to upgrade then just keep on using the previous g=671. Right?

And there’s the problem. It seems that, whatever generation of tiles you request, you’ll always get the latest version, making the g parameter completely pointless. So long as g is an integer less than or equal to 700, in fact, you’ll get the same style. Here’s generation 36, for example:

image

And here’s generation –123456789 (yes, that’s a negative sign in front):

image

It’s not that I’m resistant to change. I don’t like the new lavender style, but perhaps I could grow accustomed to it. It’s not even that I’m bitter that, once again, Microsoft have rolled out a significant change to Bing Maps without any warning or announcement. But they always handle it so badly.

Right now, for example, if you go to http://www.bing.com/maps, and select the Birds’ Eye style (and keeping the “show labels” box checked), you’ll get a map made from a bizarre mixture of old and new style labelled tiles.

image

I thought maybe this was because my browser had cached the old tiles but, no, after completely clearing the cache and checking again – these are the mixed images being served right now as generation 700 tiles:

image

Ok, so this is an annoyance, and you get odd words cut off from labels at the edges of tiles, but it doesn’t actually break any features and it’s hopefully just a by-product of the MS CDN being in the middle of changing styles. However, what is broken is the fact that you can no longer display labels when showing birds’ eye mode in “angled view” mode. Since this is the default, the behaviour a user now experiences as they zoom into the map is that, at level 12, you get a map looking like this:

image

Zoom in one level to zoom level 13 and you get this. Dude, where’s my labels?

image

I’ve no idea if this is a planned change, a known bug, or whether MS are oblivious to the fact that their flagship mapping product has just undergone a significant loss of functionality . And, meanwhile, since the upgrade to generation 700 tiles is non-optional, you have to come up with workarounds for missing labels, or explain to customers why the map colour scheme now clashes with their site design.

Garmin nuvi 1390T GPS Video Walkthrough

Video review of Garmin's nuvi 1390T

http://www.youtube.com/v/hB8Y3npRU9s?f=videos&app=youtube_gdata

Google Places Search No Longer Showing 3rd Party Review


Perhaps a small change but in light of the many quirks of late, it could also indicate more changes to come. It seems that Places search results showing in the main search results are now only showing the review count for Google only reviews. Third party reviews, while still linked are not being counted in the review totals.


Friday 29 July 2011

Russia wins the 10-th National Geographic World Championship


For the past decade, National Geographic has held a "World Championship" to test the geography skills of students from around the world. The 2011 event, sponsored by the Google Earth Team, just ended and the team from Russia was crowned champions. The Google Earth folks have sponsored this event for the past several years, but this is the first time they hosted the event at the Google headquarters in Mountain View, California.


russian-team.jpg 

The winning question: "This island has a population of about 57,000 people, with the most settlements concentrated on the west coast. Very little of this island is suitable for agriculture." It's certainly an easy one to answer if you're online, but certainly more difficult when put on the spot. Congrats to the Russian team for knowing the answer (Greenland), and more importantly -- for winning the championship!

down

Sunday 24 July 2011

Google+ And Local


I have been playing with Google+, Google’s new social network and I am impressed. Not by the fact that it is a decent social product, which it is, but by the fact that with it, Google has managed to add a social layer to all of their products in one fell swoop in a way that could very well ease the way to broader adoption by the many users of their search products.

By integrating the product into the immediacy of search, it will be a quick way to create an easily segmented stream amongst the many folks that are already in your mail address book. In doing so Google may be able to overcome the real barrier to starting a new social network, the fatigue from having to assemble yet another collection of acquantances with whom to share.

It is a product that, while not an immediate threat to Facebook, is an immediate threat to Twitter. It takes the basic idea of Twitter, enhances it with easy to create subsets of your contacts and puts it front and center in your search experience. That is a very powerful place to be, one which gets millions of users every day. Twitter, which is just starting to see broad mainstream adoption, will now have to not only with deal convincing people to use their product but getting them to even come and look. If someone is going to add a second social network, and many won’t, will they not just make the “easy” choice and stay at Google?

Facebook and Twitter have been slow to build out their Places presence and have failed to offer significant value to the local merchant. Places is already there. When you add a functioning social layer that is readily available and ever present Google may actually be the first to offer a social local product at very large scale.

Calling a product decent may seem to be damming it with faint praise. It is hard to get too excited about another social product for me and I am sure for many others. That being said, Google seems committed to this product and appears to be going for broke in positioning it as equally important as their search and local products. In doing so they gain immediate mind share and hopefully for them an easier transition for users into the world of Google social. Google has to hope that the the new interface, jarring to some long term users (I find it ok and assume I will adapt) of Google, won’t push many users to try Bing and will attract enough social participants for them to compete effectively with Twitter short haul and Facebook over the long term. Its success will be dictated by the way and the speed that it is rolled out to the great mainstream of Google users.

Melange in San Francisco


Melange, our management tool for the Google Summer of Code and Google Code-in programs, is an open source project many of whose developers are former Google Summer of Code students.

Melange developers gather from around the world four times a year to spend a week working full time on Melange. In May 2011, we held our Melange All-hands (as in All hands on deck) at the Google Office in San Francisco, CA.

We launched the new UI for Melange in late March as part of the release of Melange v2 with a new architecture which is way faster than the previous version. There was a fair amount of positive feedback from our users, the Google Summer of Code community, along with many feature requests. As such, our goal for this All-hands was to implement as many of the high priority requests as possible. For example, we implemented batch mentor invites and made legacy data accessible. In addition, one of our developers worked on the Statistics module which provides various types of statistics of students and mentors participating in the Google Summer of Code program.

The new version of Melange also had one major component missing: a way to create and administer midterm and final evaluations for both mentors and students. This was a vital piece of missing functionality, so we spent a considerable amount of time designing and implementing the pages necessary to create, edit and administer these important evaluations.


We had a dedicated brainstorming session to discuss various design issues and the changes that we wanted to implement. We also decided to switch our datastore to High Replication Datastore on Google App Engine and worked with the Google App Engine team to help us set it up.

Our Javascript guru worked on refactoring a few portions of the Javascript code such as the lists display and the templates which are internally used in Melange to write Javascript modules among other things.

We also fixed a bunch of issues during this All-hands. Some of the issues we fixed are:
  • Issue 1190 - comments that contain no content get posted to student submissions
  • Issue 1191 - disable 'self' notification by default
  • Issue 1209 - error page should show current logged in user and have link
  • Issue 1137 - batch mentor invite
  • Issue 1128 - update README for Mercurial workflow
  • Issue 1162 - style: avoid justifying text in narrow columns
  • Issue 978 - change "GSoC" and "GCI" to not be hardcoded
  • Issue 1104 - make the scope of models more explicitly
With so much work done in a single week, we feel we had quite a productive week! If you are reading this and would like to contribute to Melange, please clone our repository and start contributing. We have t-shirts waiting for you!

Saturday 23 July 2011

Managing and visualizing your location based data with Fusion Tables

Google Fusion Tables is a modern data management and publishing web application that makes it easy to host, manage, collaborate on, visualize, and publish data tables online. Fusion Tables allows for import of geospatial data to quickly and easily display that data on a Google Map.

The Fusion Tables team has been working hard to enrich what Fusion Tables offers for customization and control of the Google Map visualizations. Two very exciting announcements were made at Google I/O during the Fusion Tables session on Managing and visualizing your geospatial data with Fusion Tables. These announcements include the release of the Info Window and Styling in the Fusion Tables API and Fusion Table Styling in the Google Maps API. 


Info Window and Styling API

Previously, map styles and info window templates could only be customized via the Fusion Tables UI. The Info Window and Styling API opens up this functionality to the Fusion Tables API as well. There are many benefits of having API access to map styles and info window templates. For example:

  • This saves time when customizing hundreds of tables.
  • Since the styles and templates are JSON objects, it’s easy to serialize the objects and reuse them later.
  • The styles of public tables can be discovered and used for your own tables.
The Info Window and Styling API is still accepting Trusted Testers! If you’re interested in becoming a Trusted Tester, please join the Fusion Tables API Trusted Tester Google Group.

Fusion Tables Styles in the Google Maps API

Fusion Tables Styles
further increases the possibilities of map customization. Rather than applying a style to a table via the API or UI, styling can now be introduced on the client side using the Google Maps API. There are many benefits to Fusion Tables Styles:
  • It allows for dynamic styling of map features.
  • It’s opens up the possibility for styling tables with multiple attributes.
  • You can give your users the opportunity to decide what range of styles works best for your data.
  • Third party developers can now generate visualizations of your data that differ from your own, which makes sharing your data more powerful and useful.
Fusion Tables styles are available now! Read more about how to use Fusion Tables Styles in the Fusion Tables Layer section of the Google Maps API documentation.

We’re already seeing some really nice uses of Fusion Tables for map customization. Simon Rogers, who joined us for the Fusion Tables I/O session to talk about how the UK Guardian Datablog uses Fusion Tables, has been making great use of Fusion Tables Styles. Here’s one of the Guardian’s latest examples. If you’re interested in creating a map similar to the Guardian’s, we have developed a template for plug-and-play.

What’s new since I/O?

Ever since I/O, we’ve been working to bring you new and interesting additions to the API. For example, this past month, we added IN to the list of supported column filters. We’re working hard to bring you more cool features!


Bing Maps, brings location data to life - 5 parts


Bing Maps: Your Platform for Location-Based Solutions The Bing Maps platform brings location data to life by making it easier to visualise, understand, and analyse. The rich imagery, quality geospatial data, and leading-edge technology of Bing Maps is used by thousands of organisations, governments, and developers worldwide. Choose from a robust set of APIs to build innovative applications that quickly display data, engage users, and improve business insight. Bing Maps offers several licensing and pricing plans, including free options.

Thursday 21 July 2011

Google Offers Promises Expansion to Other US Cities

It has been clear from day one that the Google Offers daily deals were coming to both San Francisco and New York City. We just didn’t know when. THe NYC daily offers started this AM with 3 offers, one each from NYC Downtown, NYC Midtown and NYC Uptown. The deals rolled out in NYC are all moderately priced at $10/50% off and are for food ( Belgian fries, chocolates and cupcakes). Like the more recent deals in Portland, Google is no longer making explicit how many of the deals are available.

The Offers page suggests that Offers are now also available from Oakland and San Francisco although no deals were yet to be found for those cities.


And in an apparent expansion, Offers will soon be available in Austin, Boston, Denver, DC and Seattle:

Open Call for Google Developer Day

Registration for our first set of Google Developer Day (GDD) events in Latin America will begin in two weeks, with the remaining six events following shortly thereafter. As in years past, the application process requires each developer to complete a short questionnaire and optional Developer Quiz.

Numbers and statistics aside, we wanted to give you a way to really show us what you’re made of. So for 2011, we’re inviting our most passionate developers to participate in Open Call for Google Developer Day, for a chance to showcase your work alongside your peers from eight GDD countries around the world.

This year’s Open Call challenges will focus on the Android ADK and HTML5 platforms, while giving you a chance to show us why your GDD country rocks. No matter which challenge you choose, your submission must reflect the regional culture of the GDD that you will be attending, be this through music, creative imagery, lighting or colors--the opportunities are endless!

A panel of judges in each country will select 10 submissions from each of the challenges to be featured online and in-person at Google Developer Day. We will also take your submission into consideration when reviewing your GDD application. Remember that Open Call is an optional supplement to your GDD application, though you might get extra credit for participating. In many cases, this will also mean that you secure your spot at GDD before we open registration to the public.

The Android ADK Open Call will open on July 18 with the HTML5 Open Call following on August 1. In the meantime, start by brushing up on your skills and familiarizing yourself with the guidelines for Open Call at our nifty website.

Want more GDD news? Check back on this blog and stay tuned as we work on updating our GDD website to bring you the latest on locations, sessions and agenda. We're looking forward to seeing you at #gdd11!

Google Caffeine & SEO, Virtual Keyboards, 3D Maps & AdSense Earnings

This week's search video recap was, for the first time ever, broadcasted live. If you want to watch live and ask questions during the broadcast, check out www.seroundtable.com Friday mornings around 9 (EST) and follow twitter.com on Twitter for alerts on when we go live. This week we covered some rumors that Google Caffeine is live on about 80% of Google's data centers.

http://www.youtube.com/v/M63c2ofCJMo?f=videos&app=youtube_gdata

Wednesday 20 July 2011

Tripadvisor: We Can Incent Reviews but Business Can’t

The review world is full of contradictions.


Many review sites, TripAdvisor included, have strong penalties if a business is caught incenting reviews. The prohibition makes sense in that an incentive is likely to lead a reviewer to generate a low quality, less than thoughtful review in order to receive the incentive.

There is also the question of whether the incentive was a “pay to play” arrangement that would create a conflict of interest between the reviewer and the business. Effectively the review would then be an advertisement rather than an objective review.

TripAdvisor is quite clear that there should be no incentives for a reviewer to review a business. Here is the TripAdvisor guideline:

I was offered an incentive for a review – is that ok?

No. Property owners are welcome to encourage their guests to submit user reviews upon their return home, but they are not allowed to offer incentives, discounts, upgrades, or special treatment on current or future stays in exchange for reviews. If someone has offered you an incentive for a review, please tell us about it.

If TripAdvisor suspects faked or incented reviews the penalties they will “red flag” the listing with a large notice. One blogger suggested, based on a search of Google’s index, that TA had flagged as many as 13,000 properties for having faked reviews. I think the real number is quite a bit lower as the Google search stops showing results after 263 results when you click through. Regardless, the flag is a significant penalty on the business and TA has handed out quite a few of them.

I am not a fan of incenting reviews as the potential for backlash and bad publicity far outweighs the upside. In a recent case in England, The Daily Mail had this headline: Tripadvisor bribes: Hotel owners offer free rooms in return for glowing reviews. Hardly a good situation for the hotel that was attempting to create a loyalty reward via the review process.

Clearly it is not OK for a business to incent a review. But is it OK for TripAdvisor to incent reviews? They seem to think so. I received this email from them a short while ago:


The practice is not uncommon for review sites to incent reviewers. Google was doing something similar in Portland and for which they were criticized. Their response was that there was no conflict of interest created when they were doing the incenting.

While it is true that there is less incentive for a reviewer to leave just a positive review. I would contend though that the practice, while not a direct conflict of interest, does probably lead to a lower quality of review, is hypocritical on the part of the review site owner and sends a very mixed message to the business owner, one that is often misinterpretted.

In the end, if quality of review is what consumers, sites and business owners are concerned with, then the practice of incenting reviews at both the level of the business owner and the review site should be stopped.

Saturday 16 July 2011

Chrome Web Store in 41 languages and In-App Payments

Since we launched the Chrome Web Store, we’ve been working on several new improvements. Today, we’re happy to share our progress towards making the Chrome Web Store available to all Chrome users worldwide and the availability of Google In-App Payments for web app developers.

First, as we announced at Google I/O, the In-App Payments API is now available for app developers. We demo-ed the way Graphicly uses this API and Angry Birds announced that they will use it to offer users the Mighty Eagle for in-app purchase on the web. Integrating the API into your app is as simple as adding a single line of code and provides a frictionless user experience for making purchases within the app. We hope to gather feedback on the API before making it fully available this summer.

Second, the Chrome Web Store is now available in 41 languages. This is our second step towards launching Chrome Web Store in 15 additional countries. Developers interested in targeting international users can now go to the Chrome Web Store and publish free apps in these countries in preparation for launch. We will also support publishing paid apps in selected countries later this year.

Localizing your apps will expose them to many more users and allow them to be featured in the local Chrome Web Store homepages. We hope this expanded functionality will allow you to create brand new international apps or to localize your existing apps.

If you have additional questions, please take a look at our FAQ or join our developer discussion group.

Friday 15 July 2011

Google Earth: Grids and Scale Bars

Scale Bar Problem: At the moment if you click
View > Scale legend
you get a scale bar in the bottom left corner of GEarth. It isn't very usable as it works in the same space as the tour controller. Also, as you zoom in or out the bar itself stays static and just the measure of the distance changes. This doesn't work very well as users can't gauge what 3/4 of 772.1m is quickly.
My Solution: It would be a lot better if the bar itself changed size and the numbers stayed round until a new number was needed. So zooming from a scale where the scale bar initially showed 0 to 100m my idea would be to have the bar gradually expanding until it reaches a critical width at which point the bar snaps back to half its width and the scale numbers now read 0 to 200m.
Grid: Selecting
View > Grid
pulls up a grid of thin white lines that dynamically change as you zoom in and out. Ironically, its a lot like the solution I suggested for the scale bar above but in this case, I don't think it works as its all over the screen and is too visually busy. Better to Allow the user to choose to have a grid of a fixed width visible which has smallish crosses at intersections rather than having a complete grid. This would help with orientation and memory. If you're interested in reading further about landmarks in Virtual Worlds and Virtual Reality I can recomend this paper .
If you have your own suggestions as to how to improve GEarth, Google would like to hear from you. I've added my vote on the above topics...
 

Wednesday 13 July 2011

Open Street Vector Map to SQL Server


I’ve already written several posts about loading spatial data into SQL Server – using OGR2OGR, or Shape2SQL, for example. In this post, I’m going to demonstrate how you can call OGR2OGR from a PowerShell script in order to loop through and load the entire set of OS VectorMap layers into SQL Server in a few simple lines of script. Note that you’ll need the latest version of OGR2OGR (1.8) in order to play along at home, since I’ll be using the direct MSSQLSpatial driver introduced in that version.

Create the Tables

OS Vectormap data is supplied in a number of different layers, including roads, natural features, settlement areas, railway lines etc. Some of these layers represent point data, some polylines, and some polygons. (Note that there are no multi_xxx features, and a given layer contains only features of one type). Unlike some spatial formats (such as ESRI shapefiles), SQL Server lets you mix ‘n’ match different types of geometry within the same column. You could, if you wanted to, merge all the OS VectorMap features into a single table. However, since there are different additional attributes associated with each type of feature, it generally makes sense to define separate tables for each feature layer.

OGR2OGR can create tables for each feature layer in SQL Server directly, creating geometry or geography columns to hold spatial data itself and additional columns to hold any non-spatial attributes in the source data file. However, I find this to be quite unreliable; sometimes, the field lengths of the columns in the table created by OGR2OGR are set too small (e.g. numeric(5,2)), causing attribute data inserted into the table to be truncated or lead to an overflow error. Sometimes, column field lengths are set too large, which is wasteful (i.e. using nvarchar(max) to store a fixed-length two-byte string). And, sometimes, the datatype chosen for a column is just plain wrong. i.e. creating a float column to store a set of purely integer values.

So, I’d always recommend that you create the destination tables for each layer manually, specifying the correct column datatypes yourself before using OGR2OGR to load data into it. The following script can be used to create individual tables for each of the feature layers in the OS Vector Map dataset – road/railway/settlement layer/heritage/community services etc. – including all associated attribute values. Notice that I’m using the geometry datatype, and I’ve named the spatial column geom27700, indicating that all the data inserted in this column will be projected data using the EPSG:27700 spatial reference system (the National Grid of Great Britain, as used by all Ordnance Survey data):
CREATE TABLE dbo.administrativeboundary(
 ogr_fid int IDENTITY(1,1) NOT NULL,
 geom27700 geometry NULL,
 featdesc varchar(255) NULL,
 featcode int NULL,
 CONSTRAINT PK_administrativeboundary PRIMARY KEY CLUSTERED
(
 ogr_fid ASC
));

CREATE TABLE dbo.road_line(
 ogr_fid int IDENTITY(1,1) NOT NULL,
 geom27700 geometry NULL,
 featdesc varchar(254) NULL,
 featcode int NULL,
 name varchar(254) NULL,
 number varchar(30) NULL,
 CONSTRAINT PK_road_line PRIMARY KEY CLUSTERED
(
 ogr_fid ASC
));

CREATE TABLE dbo.railway_line(
 ogr_fid int IDENTITY(1,1) NOT NULL,
 geom27700 geometry NULL,
 featdesc varchar(254) NULL,
 featcode int NULL,
 CONSTRAINT PK_railway_line PRIMARY KEY CLUSTERED
(
 ogr_fid ASC
));

CREATE TABLE dbo.communityservices(
 ogr_fid int IDENTITY(1,1) NOT NULL,
 geom27700 geometry NULL,
 featdesc varchar(254) NULL,
 featcode int NULL,
 name varchar(254) NULL,
 CONSTRAINT PK_communityservices PRIMARY KEY CLUSTERED
(
 ogr_fid ASC
));

CREATE TABLE dbo.height(
 ogr_fid int IDENTITY(1,1) NOT NULL,
 geom27700 geometry NULL,
 featdesc varchar(254) NULL,
 featcode int NULL,
 height varchar(254) NULL,
 CONSTRAINT PK_height PRIMARY KEY CLUSTERED
(
 ogr_fid ASC
));

CREATE TABLE dbo.heritage(
 ogr_fid int IDENTITY(1,1) NOT NULL,
 geom27700 geometry NULL,
 featdesc varchar(254) NULL,
 featcode int NULL,
 name varchar(254) NULL,
 CONSTRAINT PK_heritage PRIMARY KEY CLUSTERED
(
 ogr_fid ASC
));

CREATE TABLE dbo.naturalfeature_area(
 ogr_fid int IDENTITY(1,1) NOT NULL,
 geom27700 geometry NULL,
 featdesc varchar(254) NULL,
 featcode int NULL,
 CONSTRAINT PK_naturalfeature_area PRIMARY KEY CLUSTERED
(
 ogr_fid ASC
));

CREATE TABLE dbo.naturalfeature_line(
 ogr_fid int IDENTITY(1,1) NOT NULL,
 geom27700 geometry NULL,
 featdesc varchar(254) NULL,
 featcode int NULL,
 CONSTRAINT PK_naturalfeature_line PRIMARY KEY CLUSTERED
(
 ogr_fid ASC
));
CREATE TABLE dbo.railway_point(
 ogr_fid int IDENTITY(1,1) NOT NULL,
 geom27700 geometry NULL,
 featdesc varchar(254) NULL,
 featcode int NULL,
 name varchar(30) NULL,
 CONSTRAINT PK_railway_point PRIMARY KEY CLUSTERED
(
 ogr_fid ASC
));

CREATE TABLE dbo.settlement_line(
 ogr_fid int IDENTITY(1,1) NOT NULL,
 geom27700 geometry NULL,
 featdesc varchar(254) NULL,
 featcode int NULL,
 CONSTRAINT PK_settlement_line PRIMARY KEY CLUSTERED
(
 ogr_fid ASC
));

CREATE TABLE dbo.settlement_area(
 ogr_fid int IDENTITY(1,1) NOT NULL,
 geom27700 geometry NULL,
 featdesc varchar(254) NULL,
 featcode int NULL,
 CONSTRAINT PK_settlement_area PRIMARY KEY CLUSTERED
(
 ogr_fid ASC
));

CREATE TABLE dbo.text(
 ogr_fid int IDENTITY(1,1) NOT NULL,
 geom27700 geometry NULL,
 featdesc varchar(254) NULL,
 featcode int NULL,
 name varchar(254) NULL,
 xml_name varchar(254) NULL,
 fonttype varchar(150) NULL,
 fontcolour varchar(30) NULL,
 fontheight varchar(30) NULL,
 orientatio numeric(30, 1) NULL,
 CONSTRAINT PK_text PRIMARY KEY CLUSTERED
(
 ogr_fid ASC
));

CREATE TABLE dbo.tidalboundary(
 ogr_fid int IDENTITY(1,1) NOT NULL,
 geom27700 geometry NULL,
 featdesc varchar(254) NULL,
 featcode int NULL,
 CONSTRAINT PK_tidalboundary PRIMARY KEY CLUSTERED
(
 ogr_fid ASC
));

Loading the geometry data with Powershell

The OS VectorMap dataset is cut into grid squares 100km x 100km across, denoted by a two letter combination, e.g. TG. Each of these squares are further subdivided into 100 10km x 10km squares, denoted by a two letter and two number combination e.g. TG20. So the directory structure of the OS VectorMap data looks like this:

image

To load the complete set of data, you need to loop through all subdirectories starting from a given base directory, then call OGR2OGR to append the data in each shapefile found therein into the appropriate feature table based on its filename. Note that not every feature layer will be found in every subdirectory (you won’t, for example, find many tidal features in Derbyshire).

And here’s a powershell script to do that loading for you. Just change the name of the base directory from which to search (c:osdata), the path to ogr2ogr.exe (c:warmerdabldbin), and the connection string to your SQL Server instance as appropriate:
get-childitem c:osdata -include *.shp -recurse | foreach ($_) {
  echo "Now loading: " $_.fullname
  C:warmerdabldbinogr2ogr -progress -append -f "MSSQLSpatial" "MSSQL:server=zangiefSQLEXPRESS;database=OSVectorMap;trusted_connection=yes;" $_.fullname -a_srs "EPSG:27700" -lco "GEOM_TYPE=geometry" -lco "GEOM_NAME=geom27700"
}
The layer creation options (-lco) supplied to ogr2ogr specify that this is geometry data in the EPSG:27700 coordinate reference system, and should be loaded into the geom27700 of each table. The other attribute values of each feature will be copied straight into the corresponding columns. Execute the script and, if all goes to plan, you should see the following as the files start to load:

image

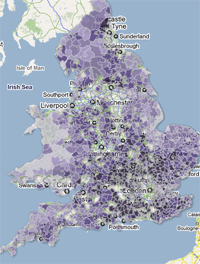
Note that loading the full set of OS Vectormap will take some time so, at this point, I’d go and get a coffee or browse facebook or something. Then, when you return, you should be in possession of one table containing the combined data for each OS VectorMap feature layer, a bit like this:

image

Tuesday 12 July 2011

UK Average Incomes on Google Maps

The UK's Office of National Statistics has used Google Maps to show the average household income estimates for different areas in England and Wales.

You can select the income measure you want to view on the map via a drop-down menu. By clicking on the map you can then view the average household income estimate at that location. You can also search the map by an address or a postcode.

The map seems to show that the nearer you live to London the more your average income is likely to be. There are a few pockets of high earning areas outside the capital but it would be interesting to compare the data on this map to a map of commuting times into London.

ONS - Income by Location

Video Case Studies: Innovate on Google Apps

The Google I/O Developer Sandbox is an annual tradition that gives innovative developers a chance to showcase their companies and technologies to others at our developer conference. This year, 24 companies were in the Google Apps Sandbox showing the products and custom solutions they’ve integrated with Google Apps. In case you weren’t able to see the Sandbox firsthand, we want to share a couple videos from these companies to spread their knowledge and excitement with the rest of the ecosystem.

Assistly - Delivering customer service, fully integrated with Gmail

Assistly is a customer support application from small to medium size enterprises, integrated with Google Apps Single Sign-On, Gmail and social networks and available for purchase on the Google Apps Marketplace. Assistly is one of many great business applications which make the vision of 100% Web viable today.

A couple spoilers:
  • 70% of Assistly users leverage Gmail
  • The Google Apps Marketplace is a Top 5 distribution channel for Assistly
 

Cloud Sherpas - Google Apps reseller, custom app and admin tools developer

Cloud Sherpas is a Google Apps reseller that helps companies migrate to Google Apps and fully utilize the suite of web-based collaboration tools. They’ve also built SherpaTools on Google App Engine, a corporate contact management and IT administration tool for Google Apps available for purchase on the Google Apps Marketplace.

A couple spoilers:
  • Cloud Sherpas has had a 3-fold increase in revenue year over year
  • SherpaTools is servicing domains totalling close to 3.5 million users
We’ve also created video case studies of 17 additional companies who are innovating using other Google technologies, such as App Engine, Chrome/HTML and Android. Check out the full playlist on the GoogleDevelopers YouTube channel.

Monday 11 July 2011

Google Street View in Monaco


Google Maps has added Street View for the principality of Monaco. As well as this new Street View imagery for Monaco the Street View trike has been busy in Switzerland.

As the second smallest country in the world (after Vatican City) it probably didn't take the Street View car too long to capture the latest imagery on Google Maps. Despite its size, however, Monaco has a lot of interesting sights.

Now you can follow the route of the Monaco Grand Prix in glorious panoramic Street View. If cars aren't your thing then you can take a virtual stroll around Monaco's quays and ogle at all the expensive yachts.


In Switzerland the Street View trike has visited the inside of Château Chillon.


It has also invaded the Three Castles of Bellinzona.


It then went on to capture Château Gruyères.


Le blog officiel de Google France, Zorgloob

Innovative products with Google technologies


Every year at Google I/O, companies arrive excited to demo their coolest new products in the Developer Sandbox. In the past, these demos were only accessible to I/O attendees. This year, we wanted to help spread the love and knowledge from these innovative companies to developers who were unable to attend the conference and to attendees who want to relive the excitement or check out companies they missed.

In addition to the "Who’s at Google I/O" guest posts you may have seen from some of our developers on this blog, we’ve created video case studies from 19 of the companies that demoed their products in this year’s I/O Sandbox. These videos highlight innovations that span the entire range of Google product areas, from Android to Google Apps and Google Web Toolkit to Google TV.

Did you know:
  • that CardinalCommerce is working with Google to enable alternative payments on the web and mobile devices?
  • that you can see what your town looked like in the 1800’s using HistoryPin’s photo layer on Google Maps?
  • that you can now play Angry Birds in Chrome? (OK, you probably knew that!)
Here are a few videos to get you started:

Watch the full playlist of videos here. As always, you can visit Google Code to learn about Google technologies you can use to build your own amazing new product.

The Sophisticutted Guide to Punning Cuts

I Won't Cut My Hair


There is an unwritten law that says if you open a new hair salon then you have to give it a silly name, preferably using some kind of pun.

In an effort to prove that this is a universal unwritten law microformats.dk has created this worldwide map of hairdressers and hair salons. The map includes many fine examples of punning titles, such as Hairway to Heaven, Clip Joint, Sophisticuts, Hair Today and Streaks Ahead.

There is a serious point to the map as it provides an example of how you can use the OpenStreetMap API to provide data for a Google Map application. For this map of hair salons microformats.dk has selected 500 of the over 20,000 hairdressers in the Open Street Map database.

Saturday 9 July 2011

“Download map area” added in Google Maps for Android

One way we bring you new product features is through Google Labs—a collection of fun, experimental features you can turn on if you’re interested in the functionality. In fact, Google Maps itself started as a lab. In addition to our desktop Maps Labs, Google Maps for Android has a few tricks you can try out right from your phone. We’d like to introduce you to one new experimental feature, “Download map area,” but also remind you of two other ones we already have: “Scale bar” and “Measure.”

Download map area
When you’re visiting an unfamiliar location, Google Maps for mobile is great for getting an idea of how close you are to your destination, where streets and landmarks are in relation to each other, or just for getting “un-lost.” But what if you don’t have a data signal, or you’re abroad and don’t have a data plan? We say that if you use Google Maps for mobile, you’ll never need to carry a paper map again. The “Download map area” lab in Google Maps 5.7 for Android is a step in making that statement true even when you’re offline.

Let’s say later you’re visiting Bordeaux during a trip to France. If you were to open Google Maps for mobile and zoom into Bordeaux without data coverage or wifi, you’d see the image on the left:


Left: Bordeaux with no data or wifi. Right: Bordeaux with downloaded map area
That’s not particularly useful when you’re trying to find out how close you are to the Cathedrale St. Andre. But a little advance planning and “Download map area” can help. Before you take your trip, while you still have access to WiFi or data coverage, you can open up any Places page in the world, click “More” to get the Place page menu, and download Google’s maps for a 10-mile radius.


Left: Tap a landmark to enter its Place page Right: Place page “more options” menu
The download can take as little as a minute or two. This download stores only the base map tiles and the landmarks on the map, so you still need a data connection to see satellite view and 3D buildings, search for Places and get directions. But we hope the level of detail available will help you find your way!


Left: Status screen for download. Right: Coverage of downloaded map area
All your downloaded map areas can be managed in your Google Maps cache settings so you can delete maps you no longer need or if you want to free up storage. After 30 days, all downloaded map areas will be removed from your cache; they can be re-downloaded any time.


Scale bar
Google Maps has approximately 20 different zoom levels that range from a 2,000 mile scale to a 20 foot scale. With finger gestures making it really quick and easy to zoom in and out, sometimes it’s not always clear what zoom level you’re at. What might be just a few streets away can be quite a long walk depending on the scale. To help with this, you can turn on a scale bar, which updates based on your zoom level.


Scale bar in the lower left
Measure
If you ever need to know the distance between San Francisco and New York (about 2602 miles) or between any other two points on the map, the “Measure” lab can help you out. Once it’s enabled, you’ll notice a tape measure icon just above the zoom buttons. After clicking that icon, you’ll be prompted to tap two points on the map and Google Maps will calculate the straight distance between those points (this direct distance is “as the crow flies”).


Example of the “Measure” Labs feature
To access Labs on your phone, press your phone’s menu button once in Google Maps, choose “More” and select Labs. On a tablet, click the menu button in the upper-right corner of Maps. The “Download map area” lab requires Android 2.1+ and the latest version of Google Maps. We look forward to bringing you more experimental features soon and hope you enjoy trying out Labs in Google Maps for Android.

Taking command of issue triage

Faster is better, especially for tedious tasks. Even though software development can be creative and exciting, it certainly has its share of tedious tasks. For example, that open source application library you developed that got users so excited? Well, now it is generating dozens of defect reports and enhancement requests for you and your teammates to sift through. Is your team growing? Are you planning a major release? Is it time to finally clean up obsolete issues? It’s awesome to be organized, but keeping up with all your issues can become tedious: click, click, click, click, click.

Today we’re launching a new issue tracking feature that allows quick edits in the issue preview window. It’s a happy medium between viewing one issue in detail and doing a bulk edit. Unlike the familiar forms-based UX that we normally use, quick edits are more command-like, keyboard-oriented, and emphasize the ability to repeat recent commands.
Previewing issues works about 40% faster than our normal issue detail page, so you can skim fast enough to achieve oneness with your backlog, then punch in some quick edits to show it who’s boss. When you’re in the zone, that click, click, click is replaced with something more like h, e, j, j, e, j, j, 2, e, j, e, j, j, j, 1, e, done! Here’s your cheat sheet:
Keystroke Action
h Toggle the issue preview window.
j or k Select the next or previous issue.
f, n, p, l Scroll to the first, next, previous, or last comment in an issue.
1, 2, 3, 4, 5 Select a recent command. If you modify the command or comment, it will be stored in that numbered slot for later reuse.
m Focus on the command text field.
e Execute the command and show the issue comment that it generated.
Not ready to go all-keyboard? Just turn on the user preference for issue preview when mousing. Then, you can do your most common and repetitive issue edits by just hovering over an ID number and clicking the Execute button.

Share This Post